01Office
16.9%
Average vacancy across the seven submarkets we track
- Net absorption
- -205k SF
- Under construction
- 85k SF
- Sublease available
- 2,962k SF
Twin Cities office, industrial, retail and investment. Demonstration site with sample content.
Downtown towers, North Loop creative space and suburban campuses, leased on your side of the table.

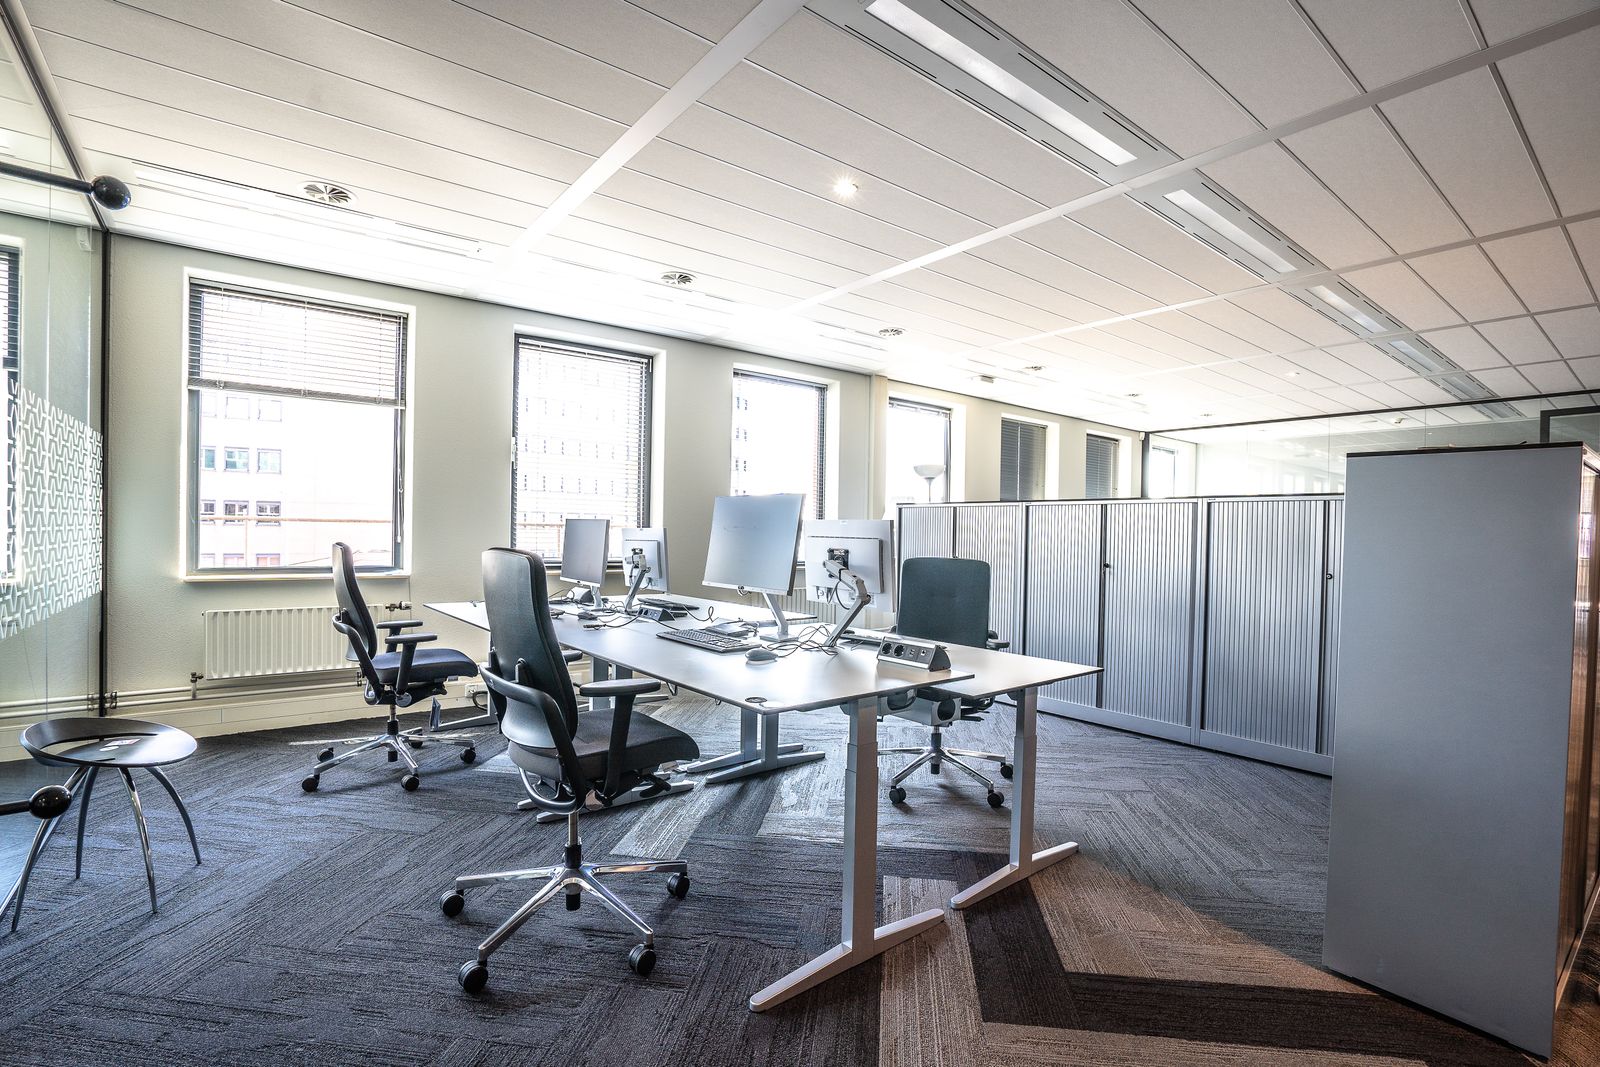

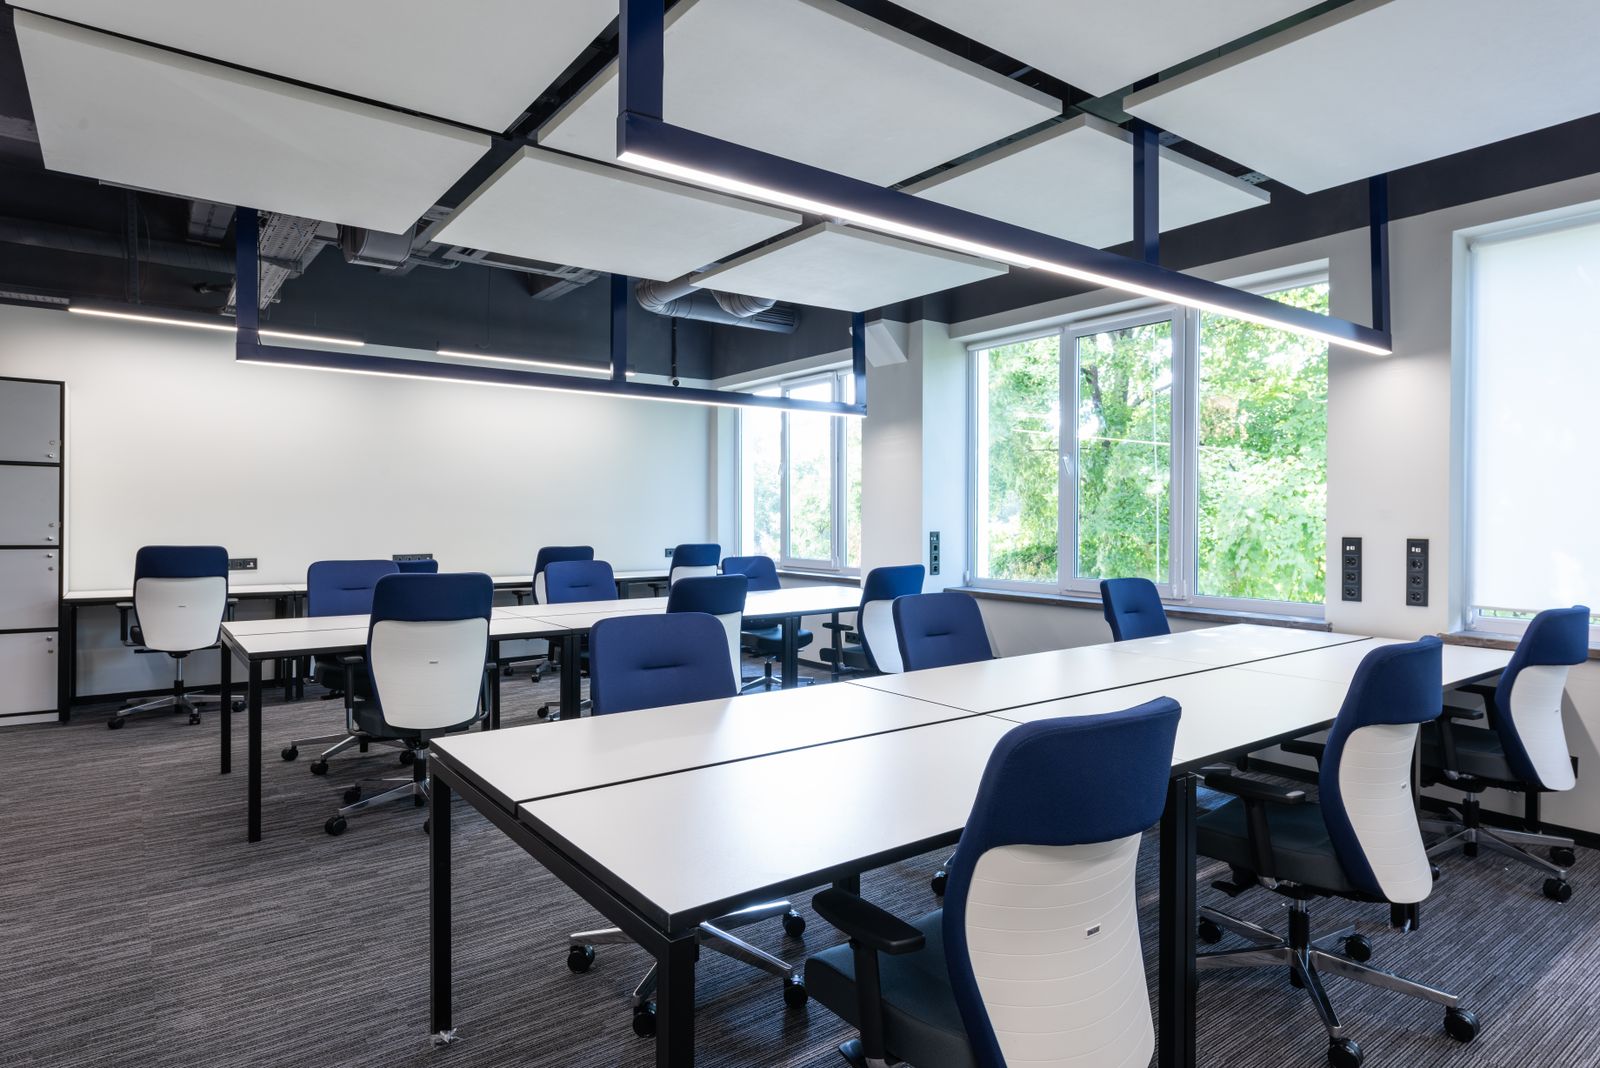
Minneapolis CBD
Distribution, light manufacturing and crossdock buildings across the airport south and northwest corridors.
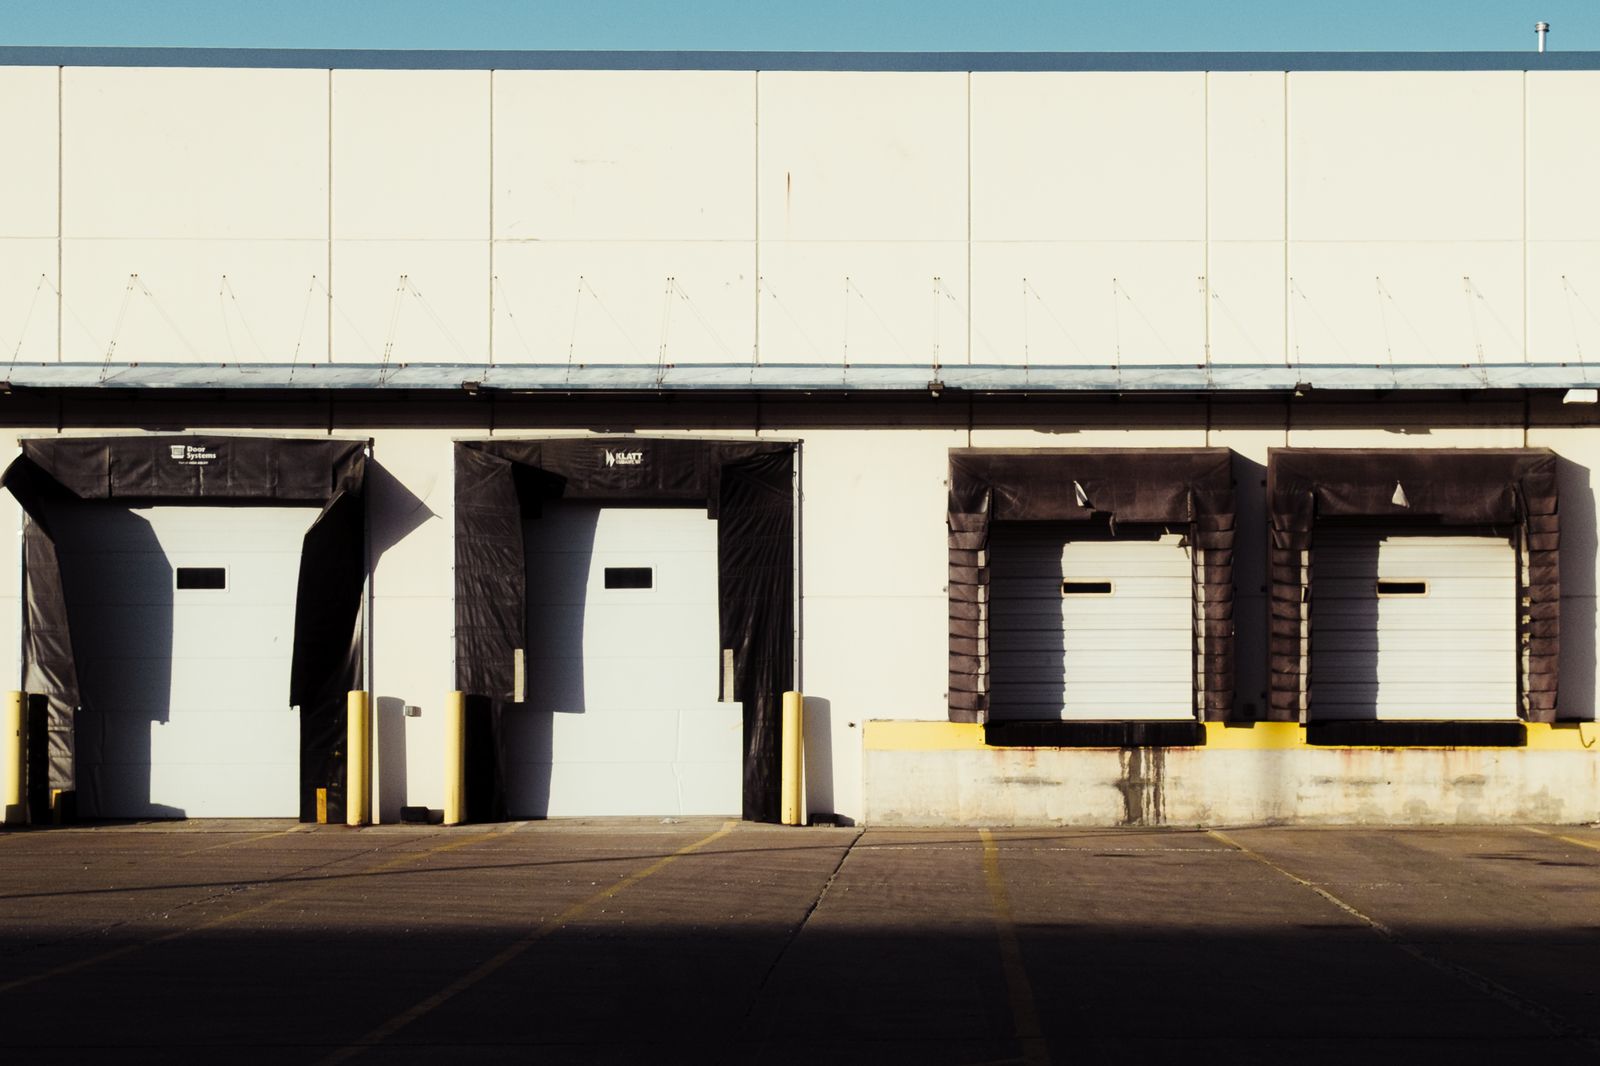
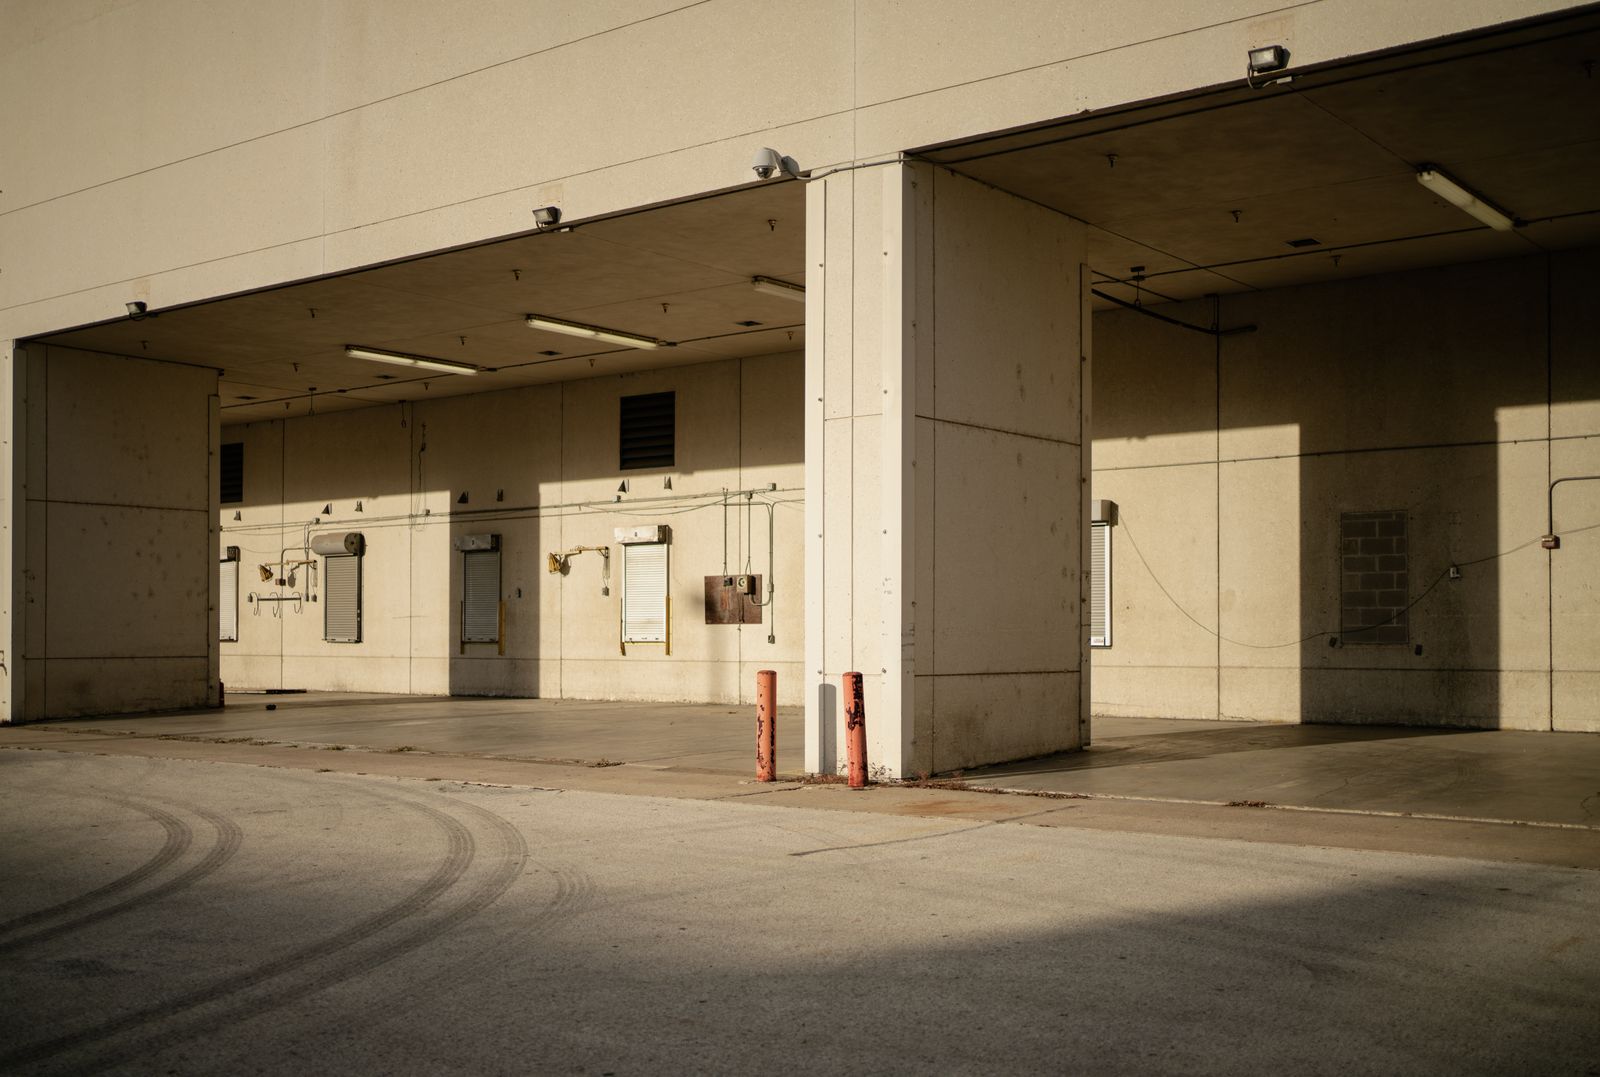
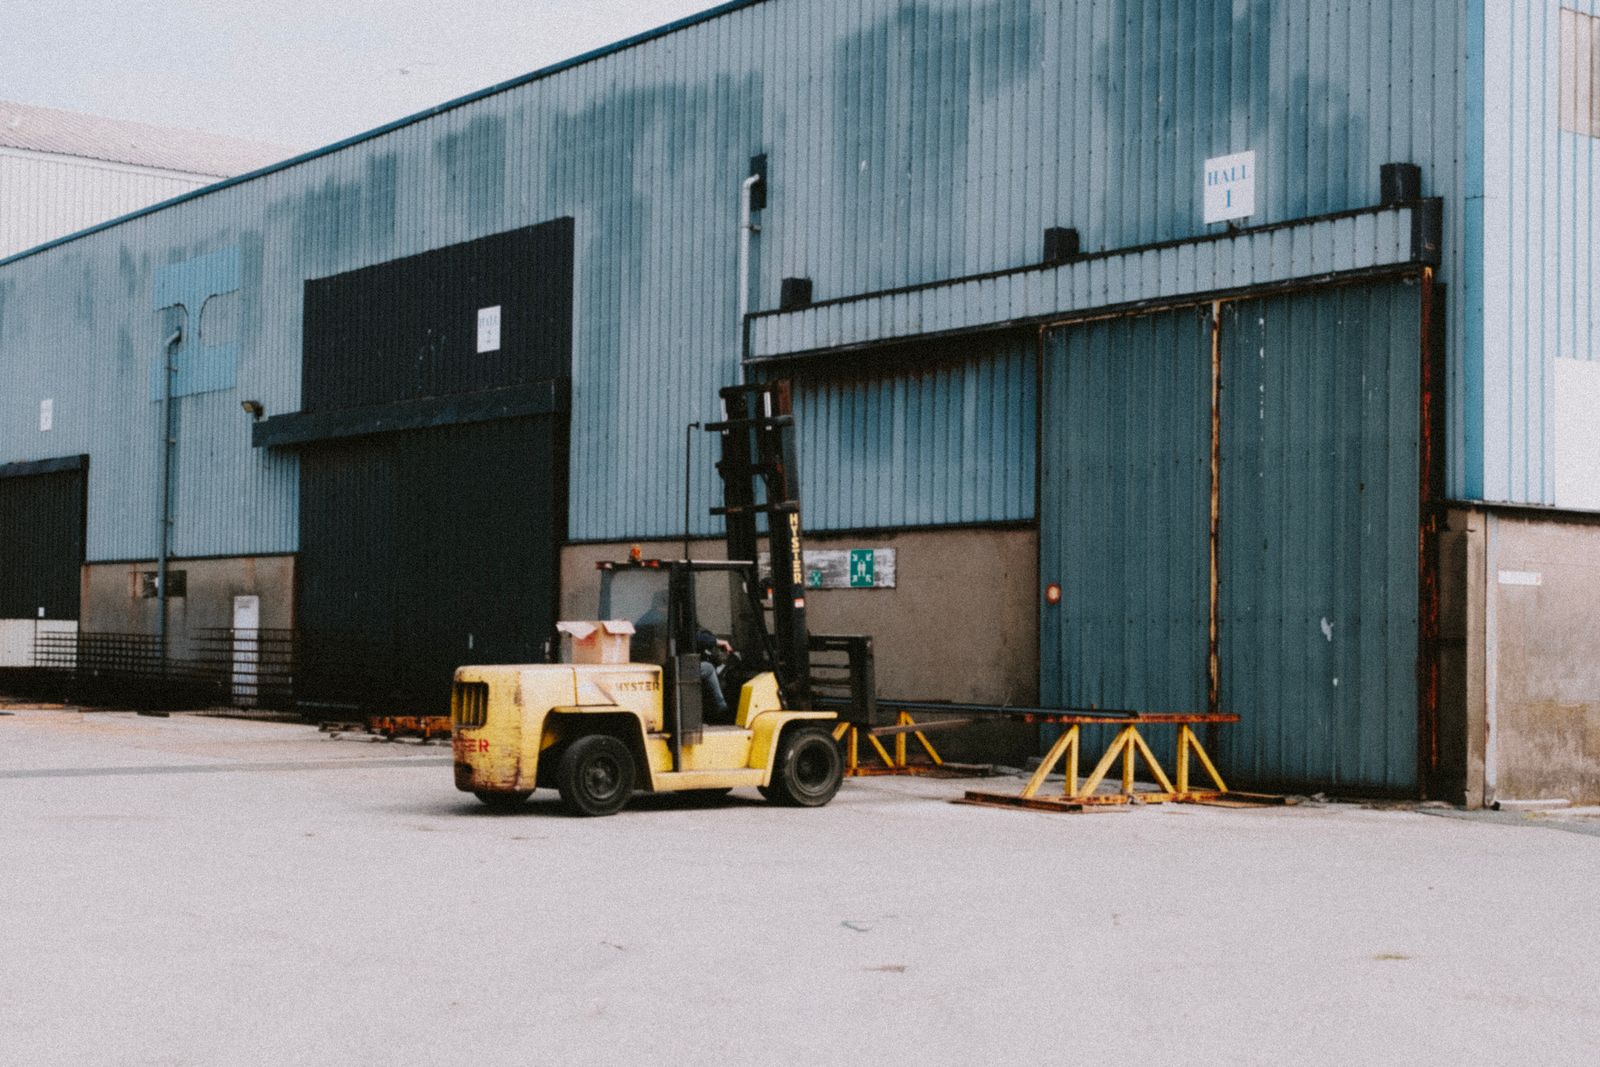
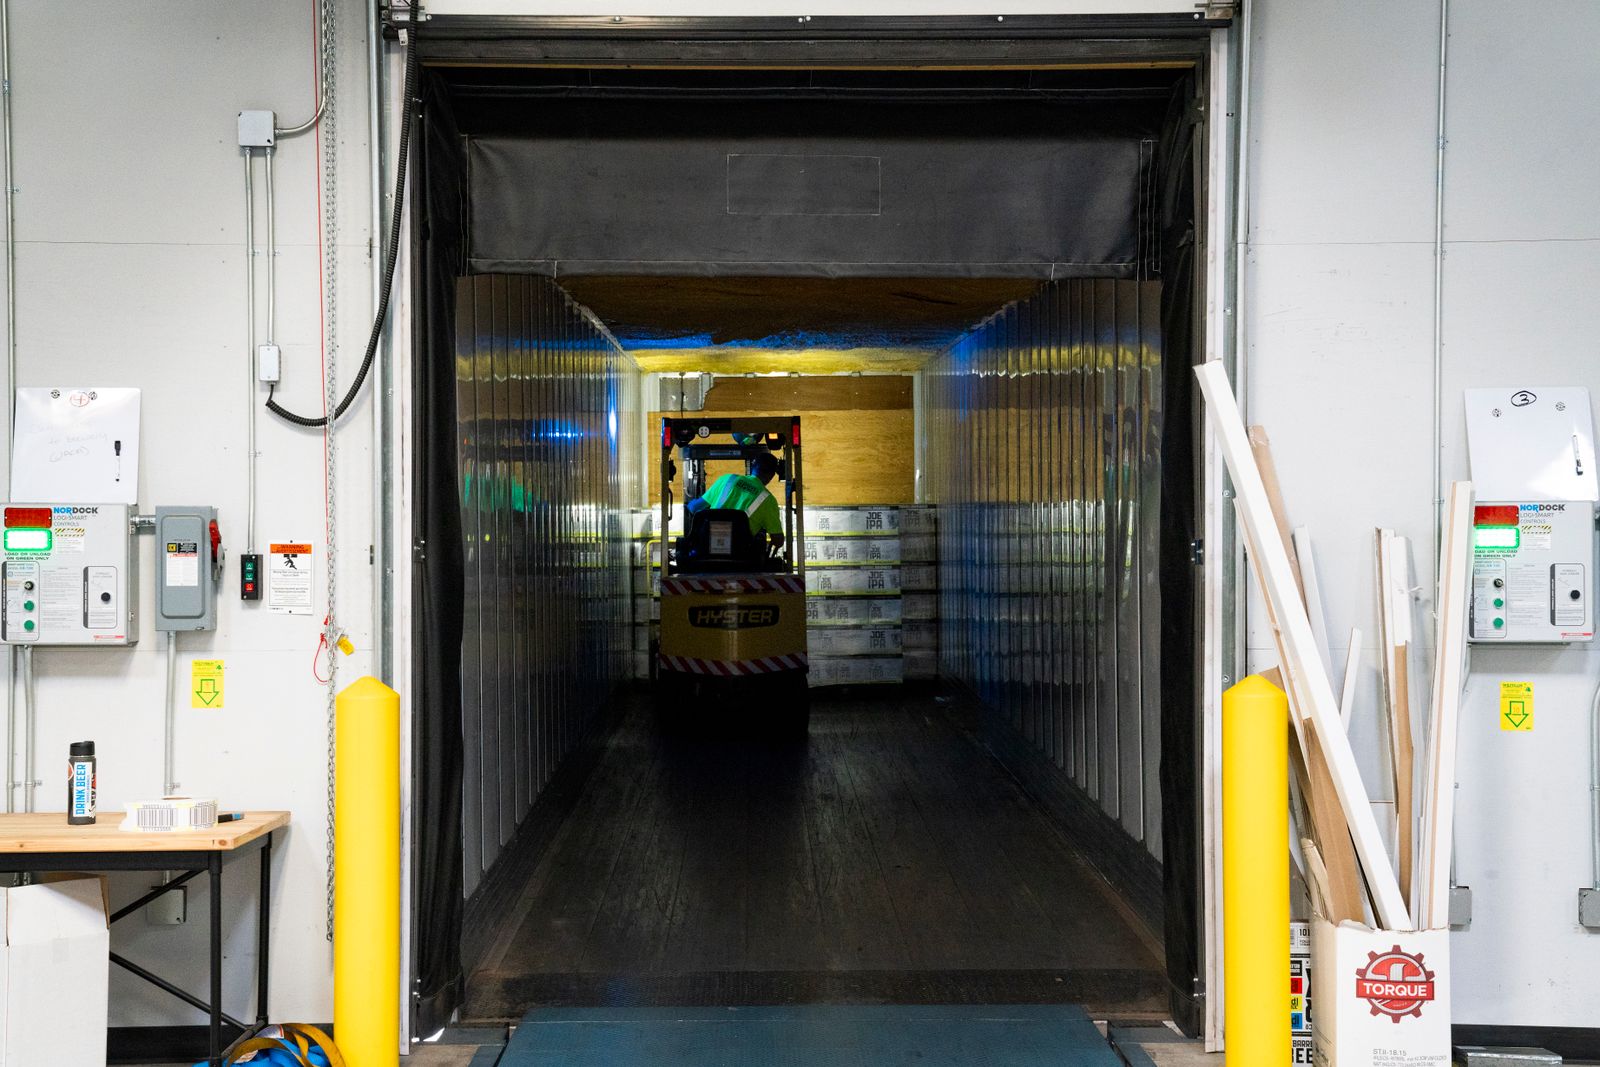
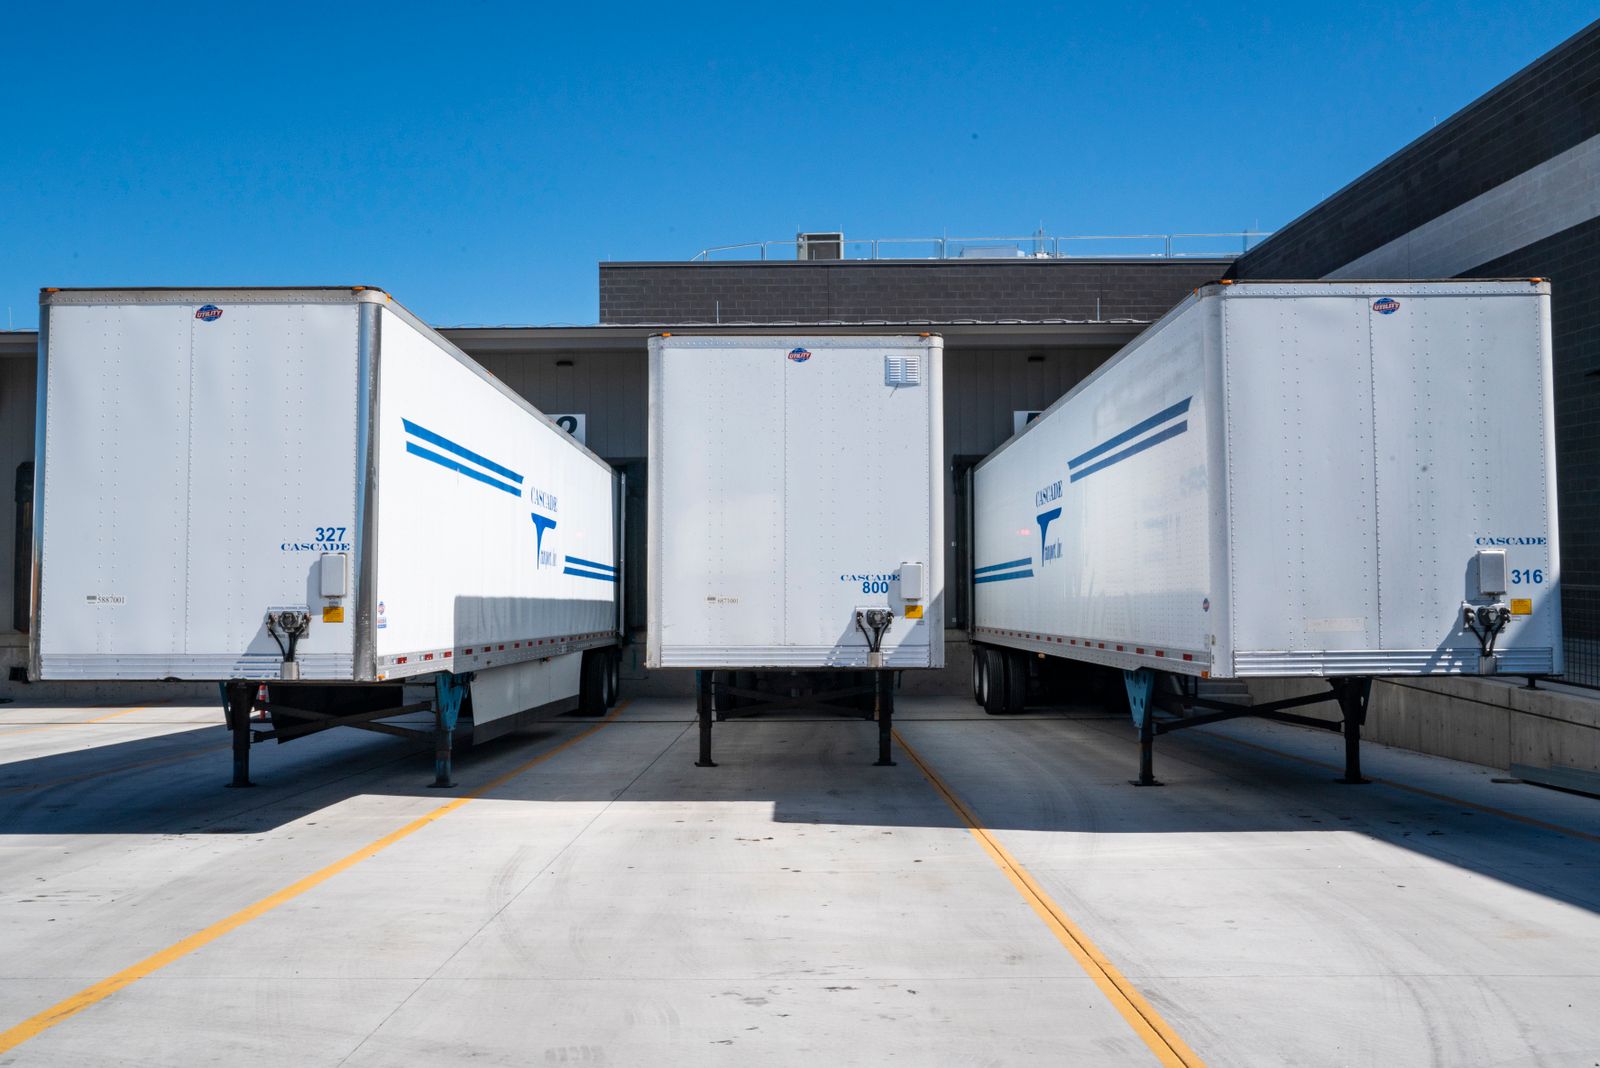

Eagan and Airport South
Endcaps, storefronts and single tenant net lease assets, priced against real Twin Cities comparables.

Retail availabilities
Six practices, one brokerage. Occupiers on one side, owners and investors on the other.






Tenant representation
MN Broker Licence #XXXXXXXX (placeholder) · Demonstration site with sample content
Vacancy, sublease availability, net absorption, construction and asking rates for office, industrial and retail across seven submarkets. Sublease is broken out because headline vacancy hides it.

16.9%
Average vacancy across the seven submarkets we track
4.0%
Average vacancy across the seven submarkets we track
6.6%
Average vacancy across the seven submarkets we track
Sample All figures on this page are illustrative samples created for a demonstration website, not published market research.
Office is the metro's weakest fundamental and its widest bargaining range. Concession packages are doing most of the work that a rate reduction would otherwise have to do.
| Submarket | Vacancy | Sublease | Net absorption | Under construction | Asking rate | Structure | Year on year |
|---|---|---|---|---|---|---|---|
| Woodbury and I-94 East | 12.8% | 38,000 SF | +46,000 SF | 0 SF | $21.20 | Full service gross | +1.9% |
| West End and Golden Valley | 13.4% | 218,000 SF | +142,000 SF | 85,000 SF | $27.40 | Full service gross | +2.6% |
| Plymouth and Maple Grove | 15.2% | 74,000 SF | +31,000 SF | 0 SF | $19.60 | Full service gross | +1.1% |
| Eagan and Airport South | 16.1% | 96,000 SF | +18,000 SF | 0 SF | $17.80 | NNN | +0.4% |
| Southwest metro | 17.4% | 286,000 SF | -46,000 SF | 0 SF | $24.90 | Full service gross | +0.8% |
| St. Paul CBD and Lowertown | 19.6% | 410,000 SF | -84,000 SF | 0 SF | $16.20 | NNN | -0.9% |
| Minneapolis CBD | 23.8% | 1,840,000 SF | -312,000 SF | 0 SF | $18.90 | NNN | -1.8% |
Quoted full service gross.
Quoted full service gross.
Quoted full service gross.
Quoted nnn.
Quoted full service gross.
Quoted nnn.
Quoted nnn.
Industrial vacancy has been under six percent in every submarket we track for three years. Modern product at 32 feet clear is tighter than the headline figure suggests.
| Submarket | Vacancy | Sublease | Net absorption | Under construction | Asking rate | Structure | Year on year |
|---|---|---|---|---|---|---|---|
| West End and Golden Valley | 2.9% | 34,000 SF | +61,000 SF | 0 SF | $12.10 | NNN | +6.2% |
| Minneapolis CBD | 3.1% | 18,000 SF | +24,000 SF | 0 SF | $11.40 | NNN | +4.4% |
| Eagan and Airport South | 3.4% | 214,000 SF | +1,240,000 SF | 1,850,000 SF | $7.65 | NNN | +7.8% |
| Southwest metro | 3.8% | 44,000 SF | +118,000 SF | 95,000 SF | $11.90 | NNN | +5.8% |
| St. Paul CBD and Lowertown | 4.2% | 61,000 SF | +96,000 SF | 120,000 SF | $9.65 | NNN | +5.1% |
| Plymouth and Maple Grove | 4.8% | 168,000 SF | +620,000 SF | 740,000 SF | $8.85 | NNN | +5.4% |
| Woodbury and I-94 East | 5.6% | 52,000 SF | +288,000 SF | 310,000 SF | $10.40 | NNN | +4.6% |
Quoted nnn.
Quoted nnn.
Quoted nnn.
Quoted nnn.
Quoted nnn.
Retail is bifurcated by income. The southwest quadrant is effectively full; the eastern edge is still absorbing new supply as rooftops arrive.
| Submarket | Vacancy | Sublease | Net absorption | Under construction | Asking rate | Structure | Year on year |
|---|---|---|---|---|---|---|---|
| Southwest metro | 3.6% | 14,000 SF | +74,000 SF | 38,000 SF | $34.80 | NNN | +4.2% |
| Woodbury and I-94 East | 4.4% | 9,000 SF | +68,000 SF | 94,000 SF | $29.60 | NNN | +3.8% |
| Plymouth and Maple Grove | 4.9% | 6,000 SF | +44,000 SF | 62,000 SF | $27.80 | NNN | +3.0% |
| West End and Golden Valley | 5.8% | 11,000 SF | +52,000 SF | 24,000 SF | $31.20 | NNN | +3.4% |
| Eagan and Airport South | 6.6% | 8,000 SF | +22,000 SF | 18,000 SF | $24.40 | NNN | +2.1% |
| Minneapolis CBD | 9.4% | 42,000 SF | +38,000 SF | 46,000 SF | $28.50 | NNN | +1.2% |
| St. Paul CBD and Lowertown | 11.2% | 26,000 SF | +14,000 SF | 0 SF | $22.75 | NNN | +0.6% |
Quoted nnn.
Quoted nnn.
Quoted nnn.
Quoted nnn.
Quoted nnn.
This is the checklist we walk an industrial building with. Every line has cancelled a deal at some point, usually after the tenant had already fallen for the building.
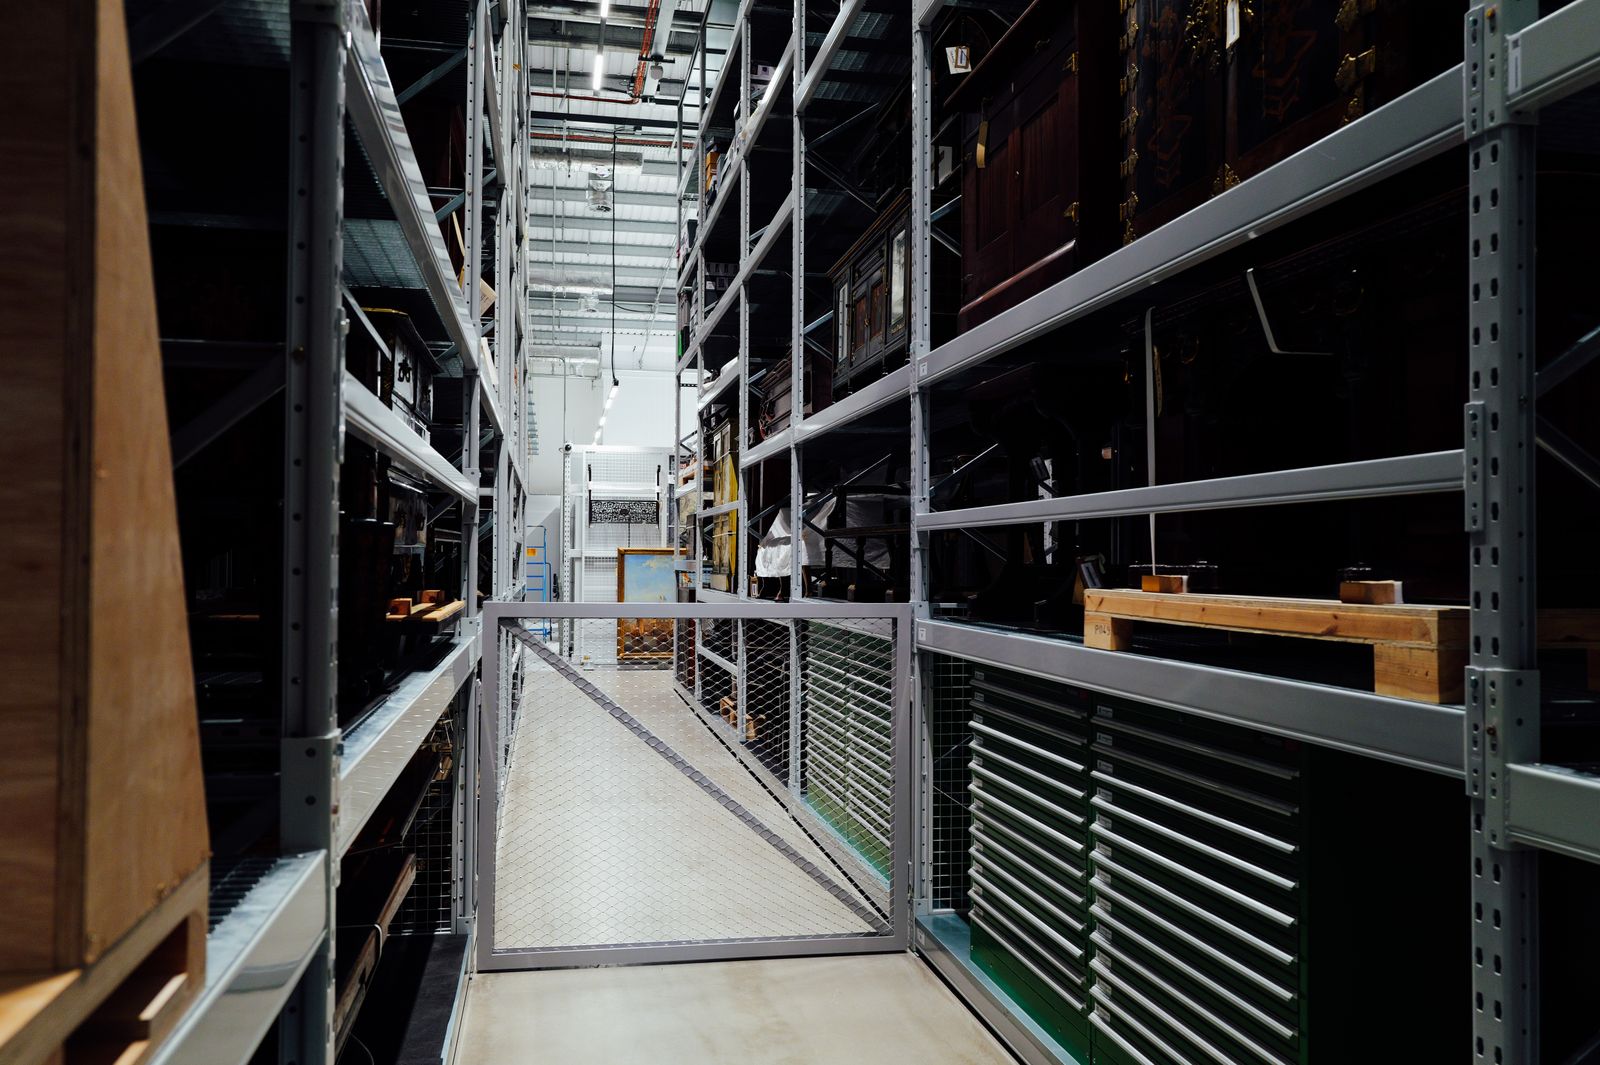
A submarket at 4.8 percent industrial vacancy can still have only three options for a 100,000 square foot requirement at 32 feet clear, because most of the standing stock is shorter.
A sublandlord with 34 months left will undercut a direct landlord who is underwriting a ten year hold. Always ask what share of the availability is sublease.
In a soft office submarket the spread between asking and achieved can be two to four dollars before you count free rent and improvement allowances.
A full service gross quote and a triple net quote are not comparable until the operating expense load is added to one of them.
We publish submarket fundamentals four times a year. Ask for the current edition and tell us which property types you care about.
We value your privacy
We use cookies to run this site, remember your preferences and understand how it is used.Cookie policy