018 inputs
Occupancy cost and net effective rate
Turn a proposal into an annual cost and a net effective rate over the term.
Open the calculatorTwin Cities office, industrial, retail and investment. Demonstration site with sample content.
Downtown towers, North Loop creative space and suburban campuses, leased on your side of the table.

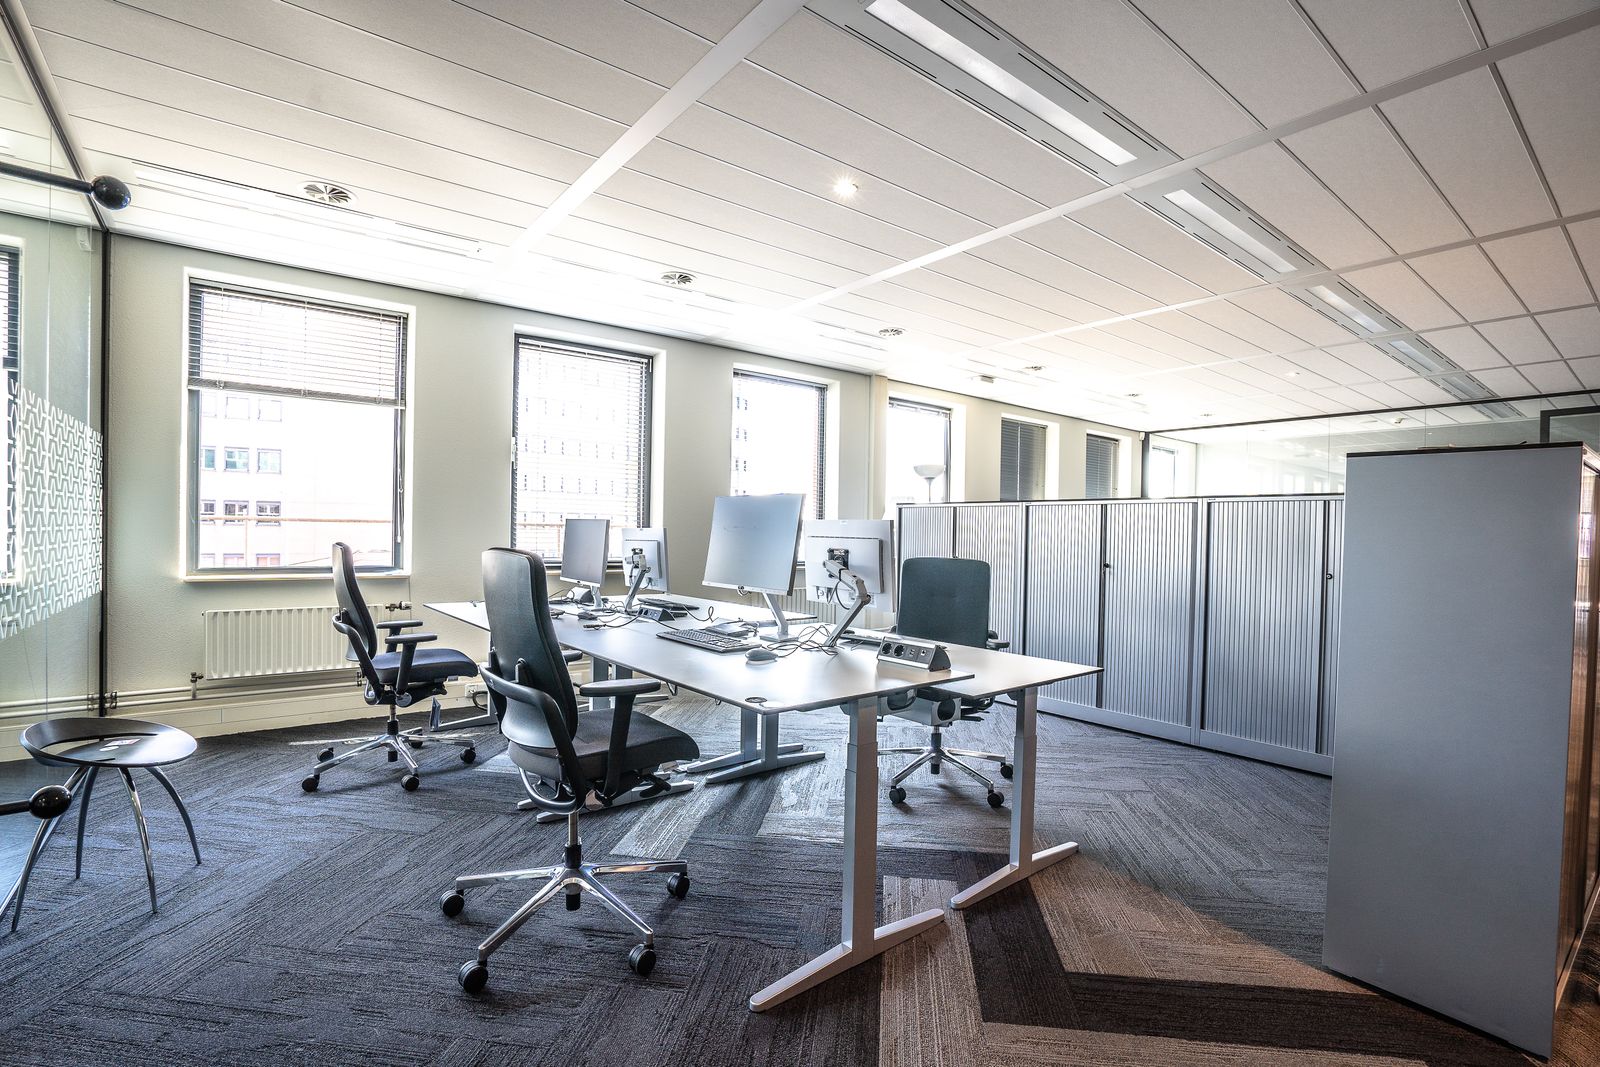



Minneapolis CBD
Distribution, light manufacturing and crossdock buildings across the airport south and northwest corridors.

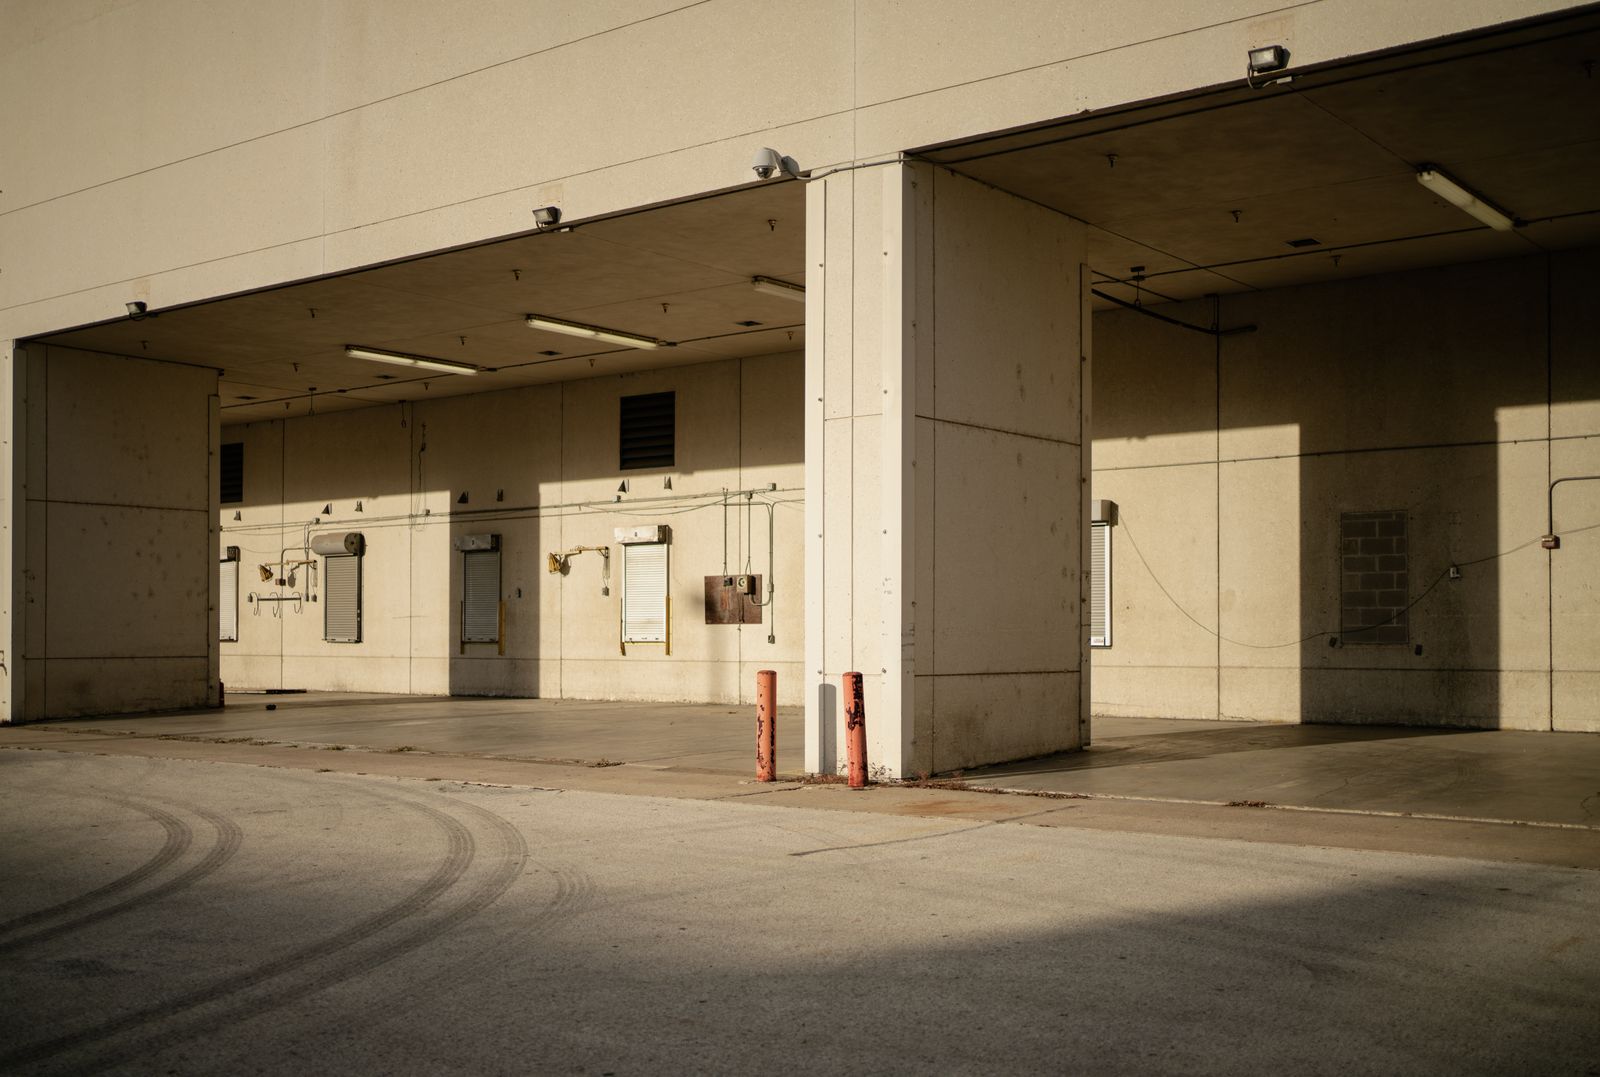

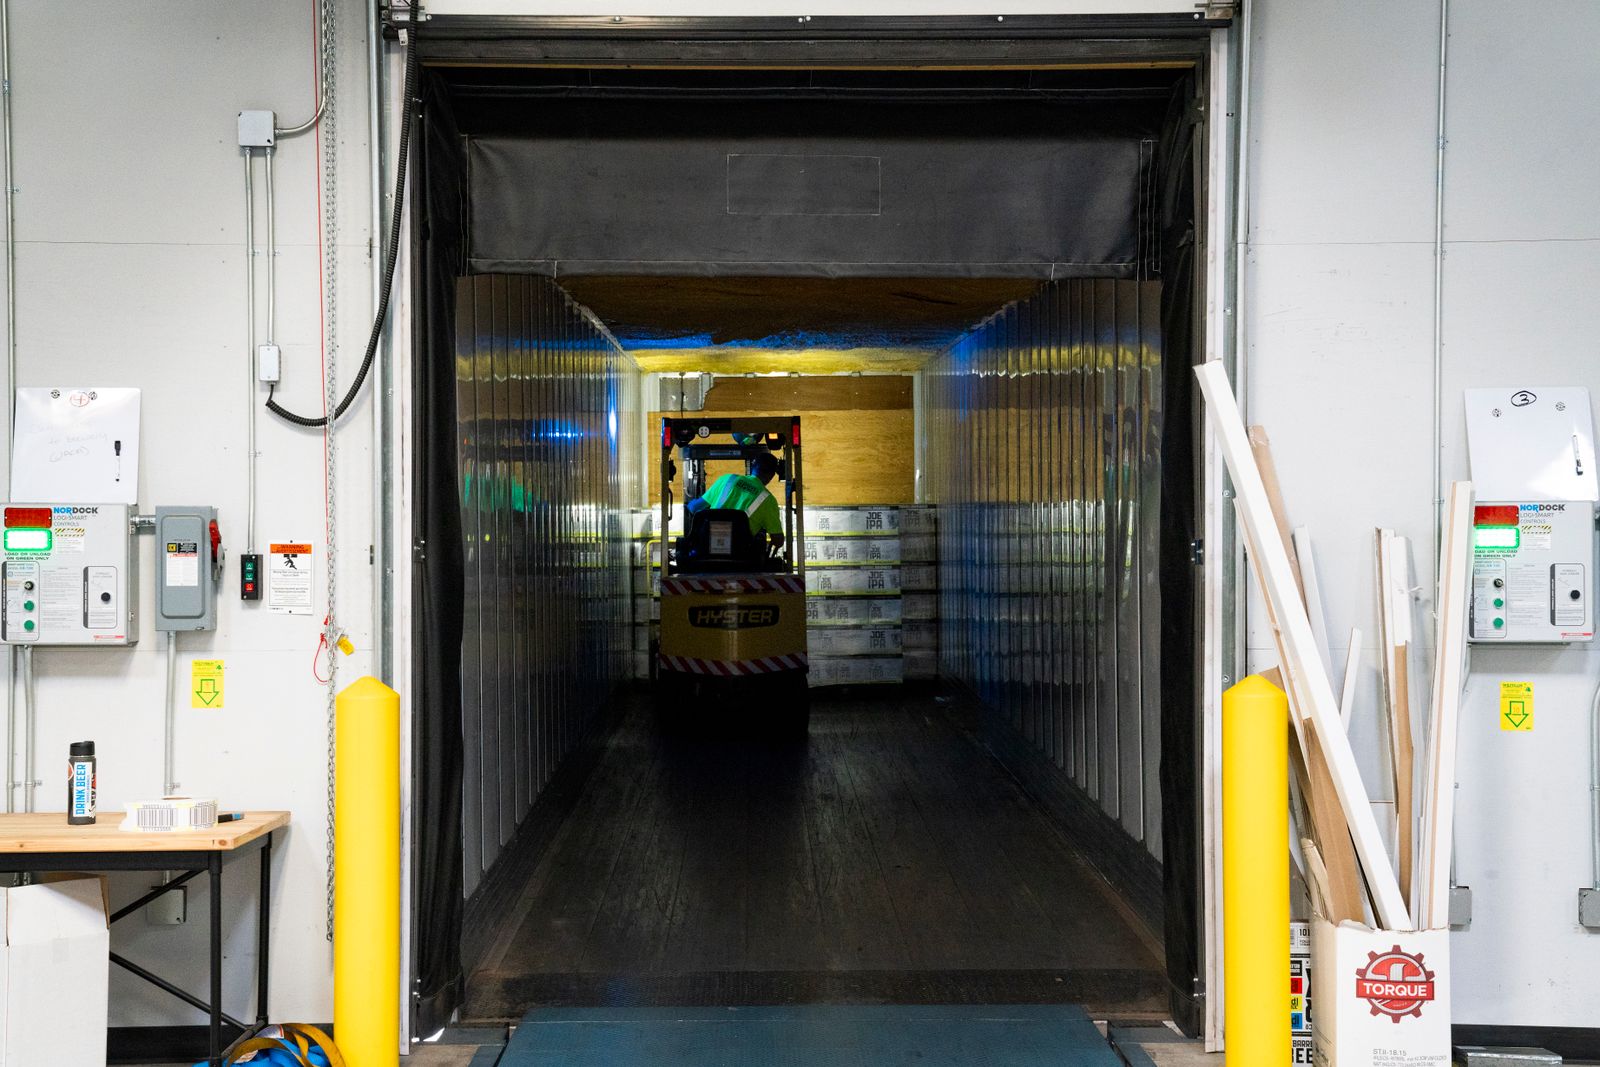
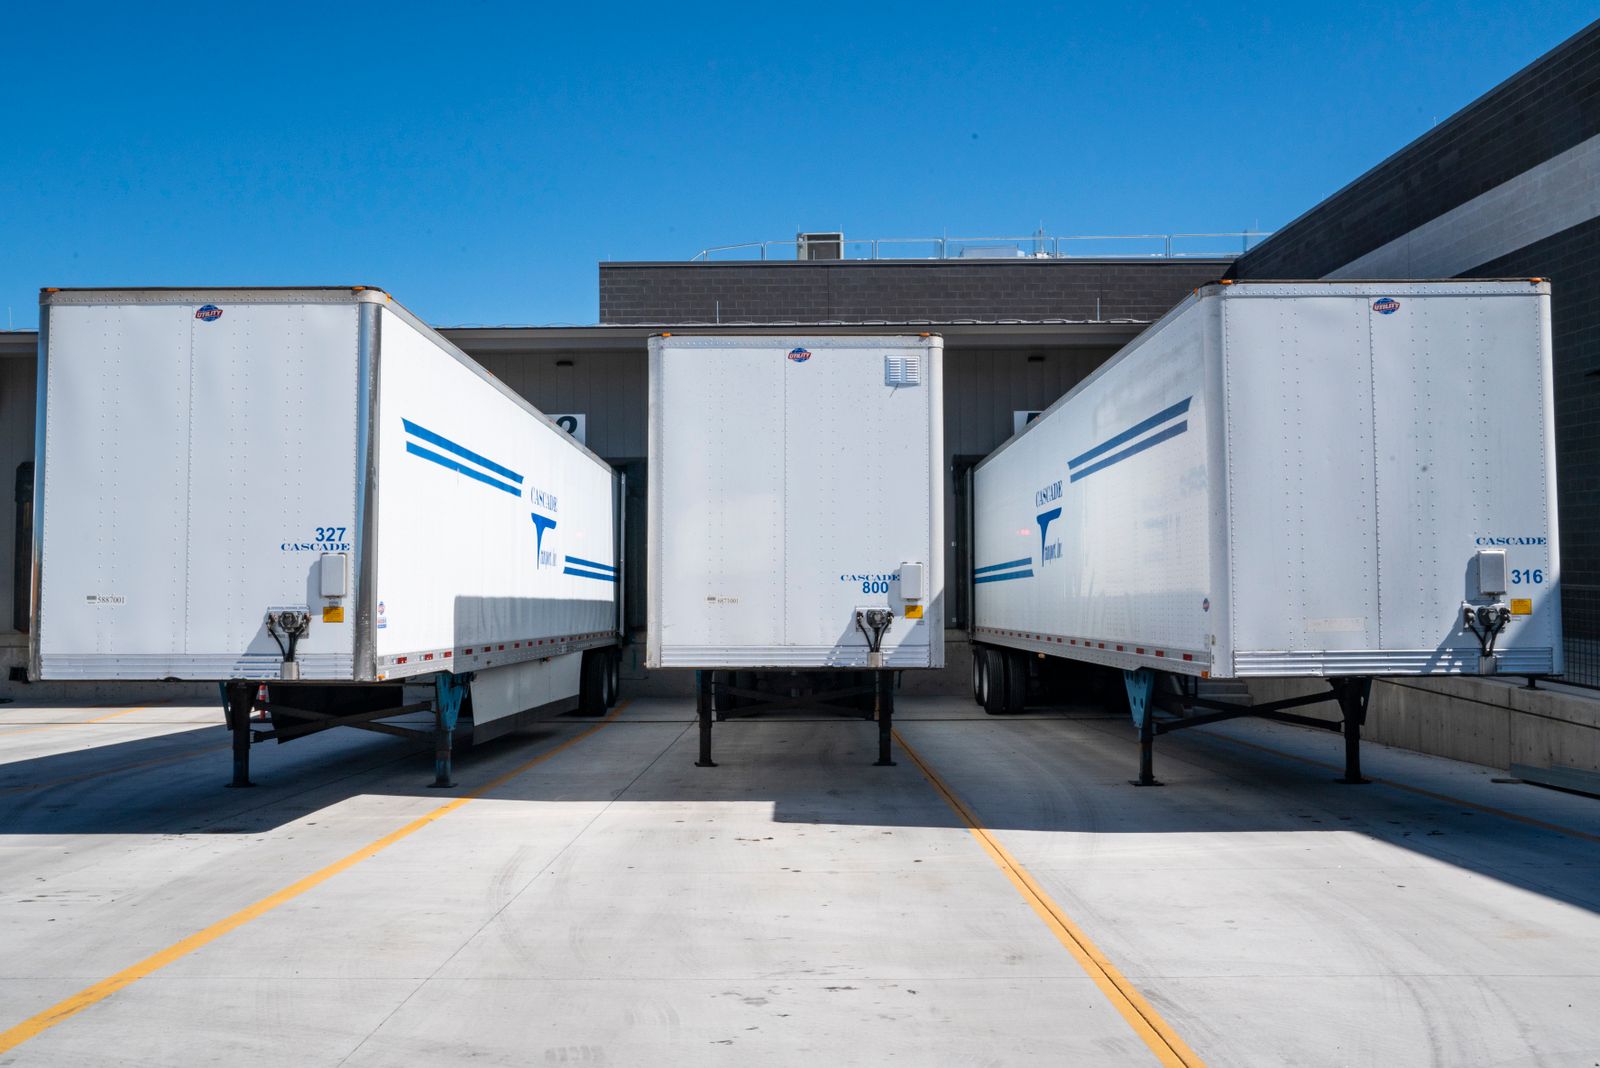

Eagan and Airport South
Endcaps, storefronts and single tenant net lease assets, priced against real Twin Cities comparables.





Retail availabilities
Six practices, one brokerage. Occupiers on one side, owners and investors on the other.






Tenant representation
MN Broker Licence #XXXXXXXX (placeholder) · Demonstration site with sample content
Net operating income, then value at a cap rate, then the loan a lender will actually write. Most deals in this market are sized by coverage rather than by loan to value, and the difference lands on your equity.

Net operating income, then value at a cap rate, then loan sizing under both constraints a lender applies. Most deals are sized by coverage, not by loan to value, and the difference is the equity cheque.
Rentable area multiplied by market rent, as if the building were fully leased at today's rate. Not what the rent roll says today.
Less vacancy and credit loss. Use a rate that reflects the submarket and the covenant, not a flat five percent because it looks tidy.
Less operating expenses and less a capital reserve. This is the number the whole valuation rests on, so it is the number to attack hardest.
Net operating income divided by the capitalisation rate. Price per square foot is a sanity check against the comparable set, not a valuation method.
The lower of the loan to value maximum and the coverage constrained loan at an amortising payment. The model names which one binds.
Value less loan is the equity. Net operating income less annual debt service, divided by that equity, is the cash on cash return before tax.
| Finding | Where it surfaces | Typical effect |
|---|---|---|
| Operating expense reconciliation never signed off | Estoppel responses | Reduces recoverable income |
| Roof with less remaining life than represented | Property condition assessment | Immediate capital, re-trade |
| Historical dry cleaning or fuelling use | Environmental Phase I | Phase II, delay, possible walk |
| Encroachment or easement not on the title commitment | ALTA survey | Title endorsement or price |
| Below market lease with a long option | Lease abstract | Reduces the mark to market |
| Service contracts that do not terminate on sale | Contract review | Raises operating expenses |
Sample A screening model for a demonstration website. It is not an appraisal, a loan quote or investment advice. A broker opinion of value is not prepared by a licensed appraiser and is not USPAP compliant.
Because the debt service coverage constraint is binding. A lender sizes the loan on the lower of two numbers: the loan to value maximum and the loan whose annual payment the net operating income can cover at the required coverage ratio. When interest rates rise, coverage binds long before loan to value does, and the equity cheque grows.
Conventional commercial lenders in this market commonly require 1.20 to 1.35 times on stabilised income producing property, with the higher end for single tenant assets and shorter remaining lease terms. Model 1.25 unless your lender has told you otherwise. That is a sample planning range.
Because roofs, parking surfaces and rooftop units wear out whether or not the loan documents make you escrow for them. Underwriting without a reserve overstates net operating income and therefore overstates value. Twenty to fifty cents per square foot per year is a common planning figure depending on asset age and type.
From the comparable sales where a going-in cap rate can actually be established, then adjust for lease term remaining, tenant credit, building age and condition, and the depth of the buyer pool for that asset type and size. Do not use the rate a broker quoted you for a different property type in a different submarket.
No. Title, survey, environmental, legal, lender fees and any immediate capital all sit outside this model. On a small asset they can easily add two to four percent to your basis, which reduces the cash on cash return the model reports.
Turn a proposal into an annual cost and a net effective rate over the term.
Open the calculatorHow much common area you are renting and what it costs a year.
Open the calculatorTen to fifteen business days from a complete rent roll and operating history, with the comparables and the arithmetic attached.
We value your privacy
We use cookies to run this site, remember your preferences and understand how it is used.Cookie policy