01Office
- Vacancy
- 23.8%
- Sublease
- 1,840,000 SF
- Absorption
- -312,000 SF
- Under construction
- 0 SF
- Asking rate
- $18.90
- Year on year
- -1.8%
Quoted nnn.
Twin Cities office, industrial, retail and investment. Demonstration site with sample content.
Downtown towers, North Loop creative space and suburban campuses, leased on your side of the table.

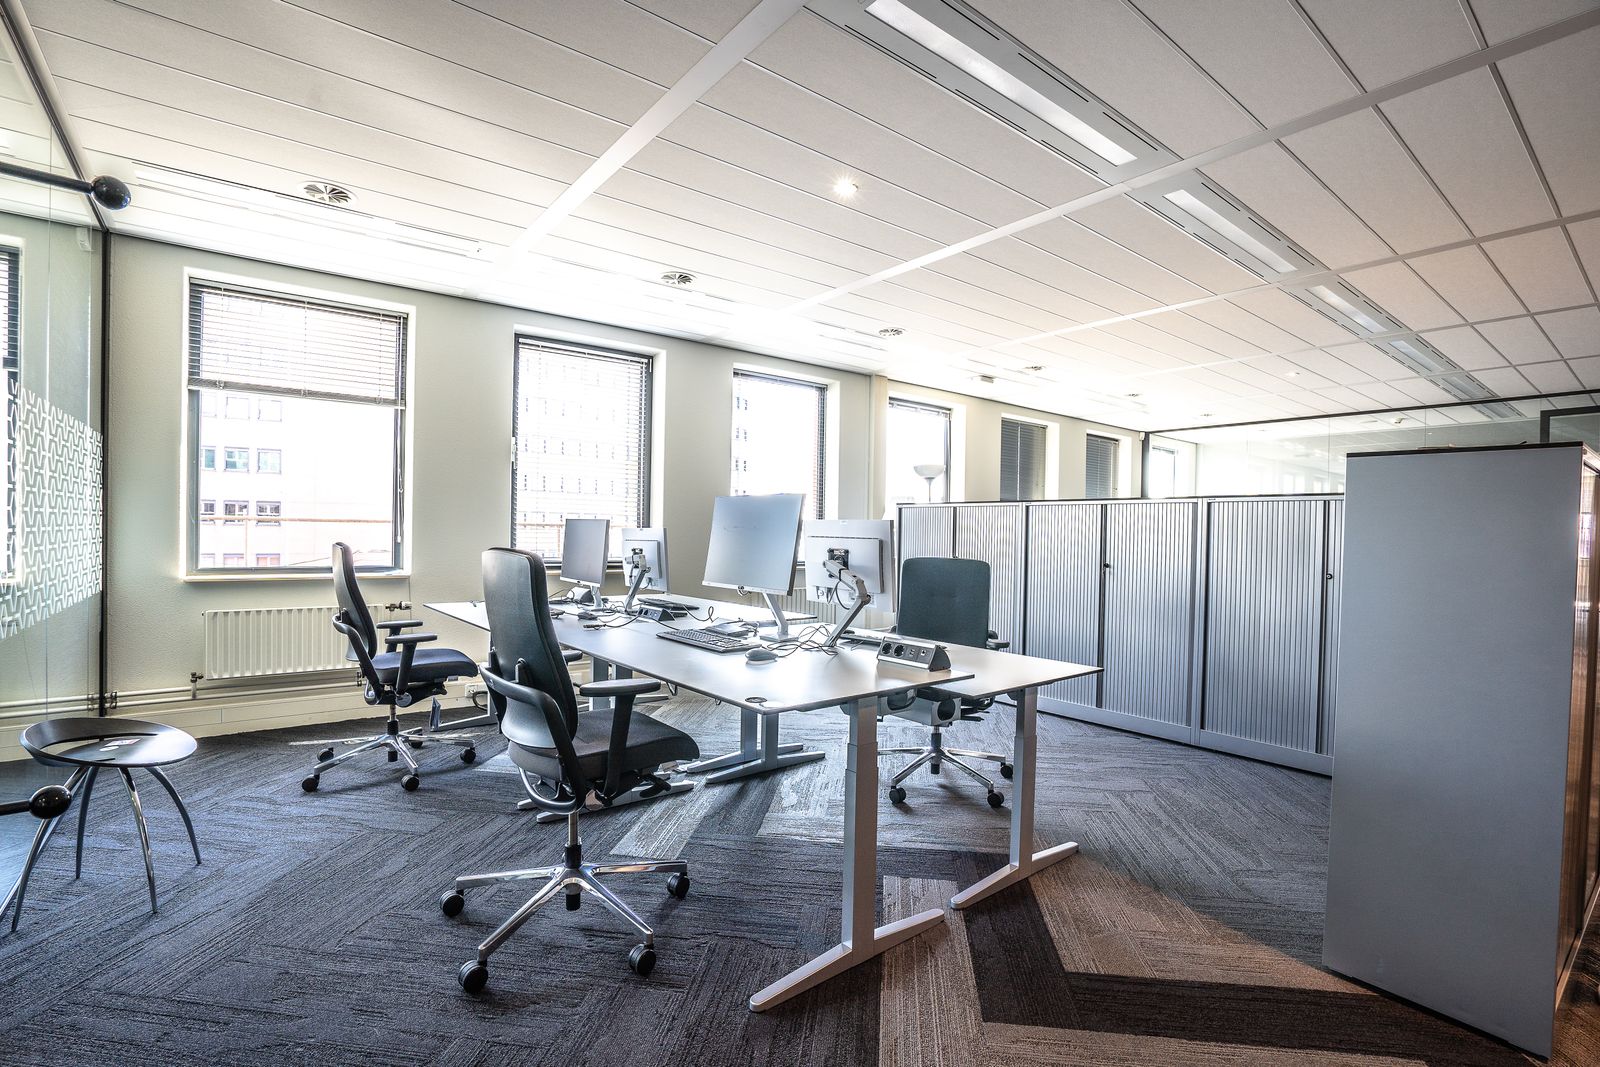


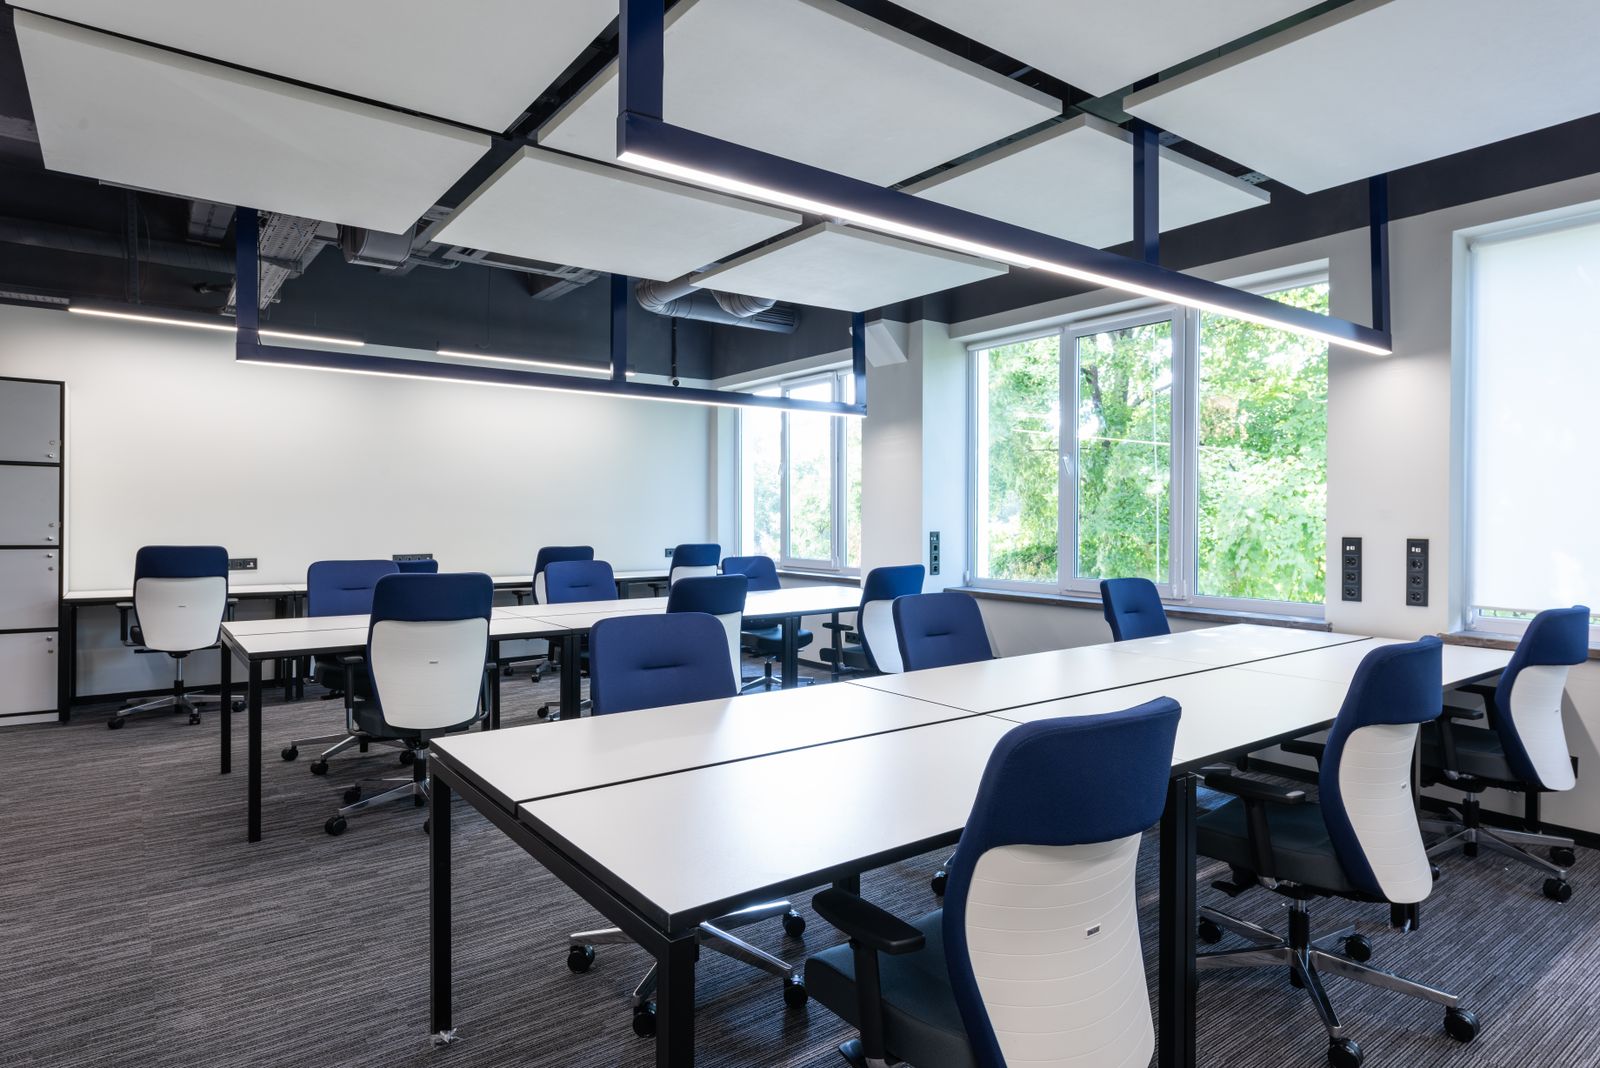
Minneapolis CBD
Distribution, light manufacturing and crossdock buildings across the airport south and northwest corridors.
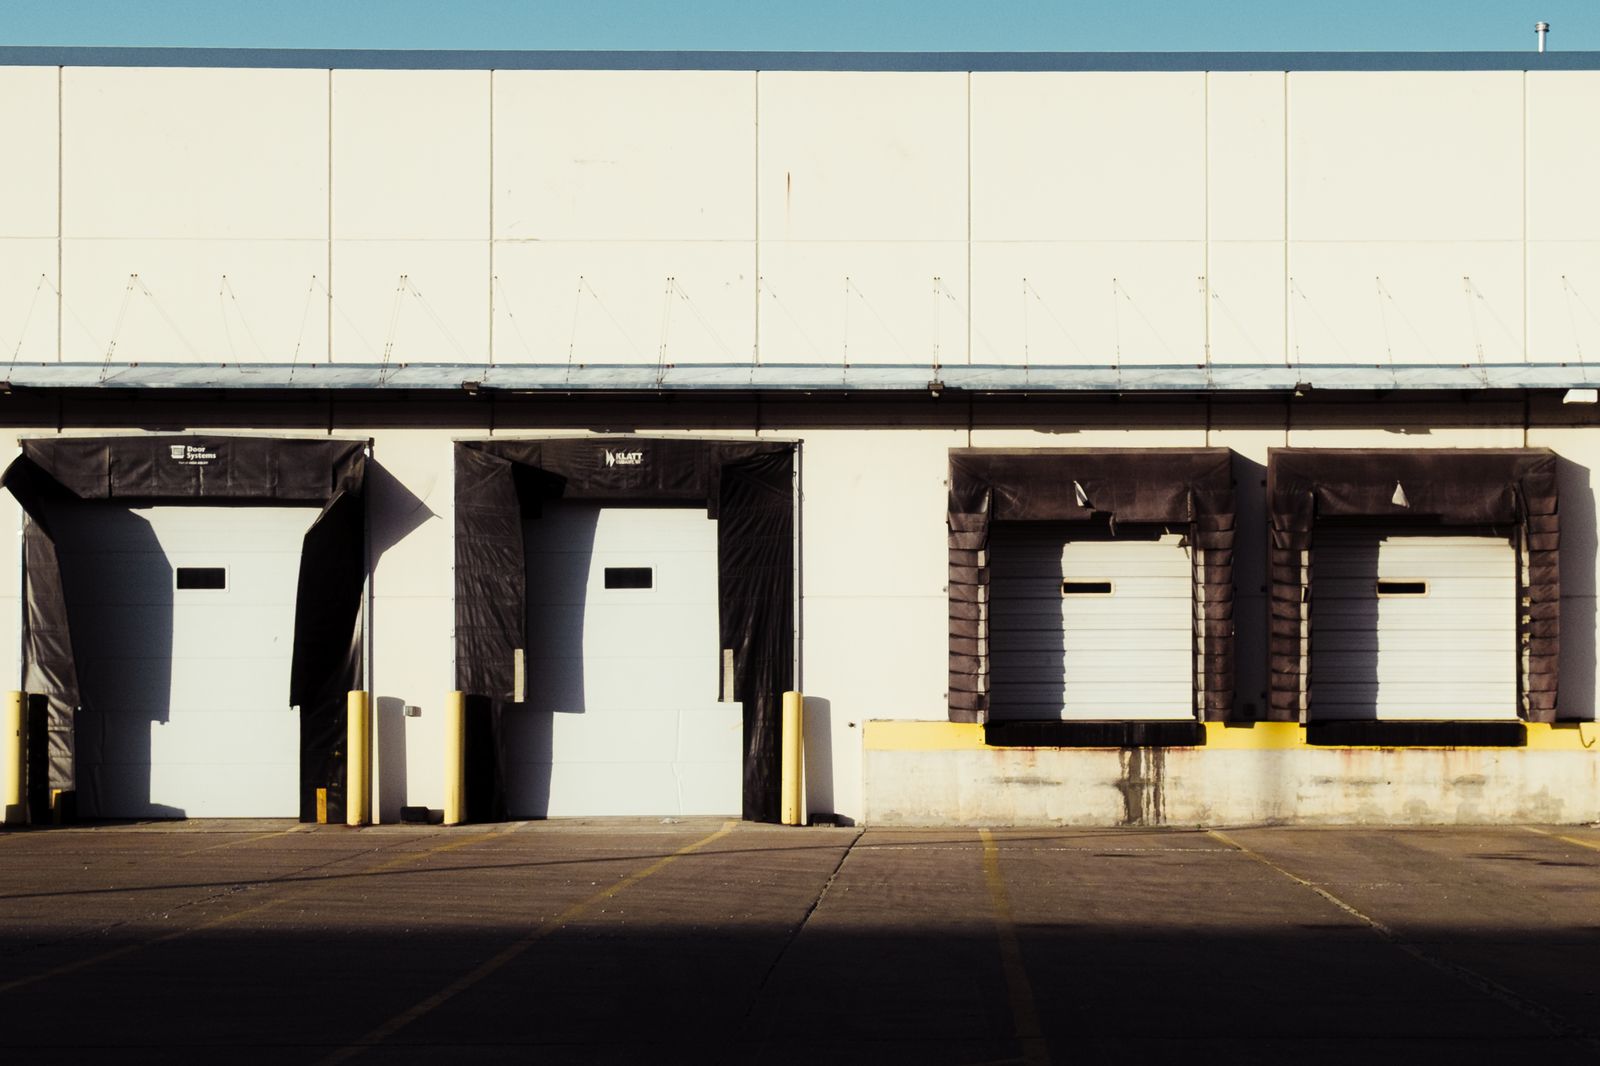
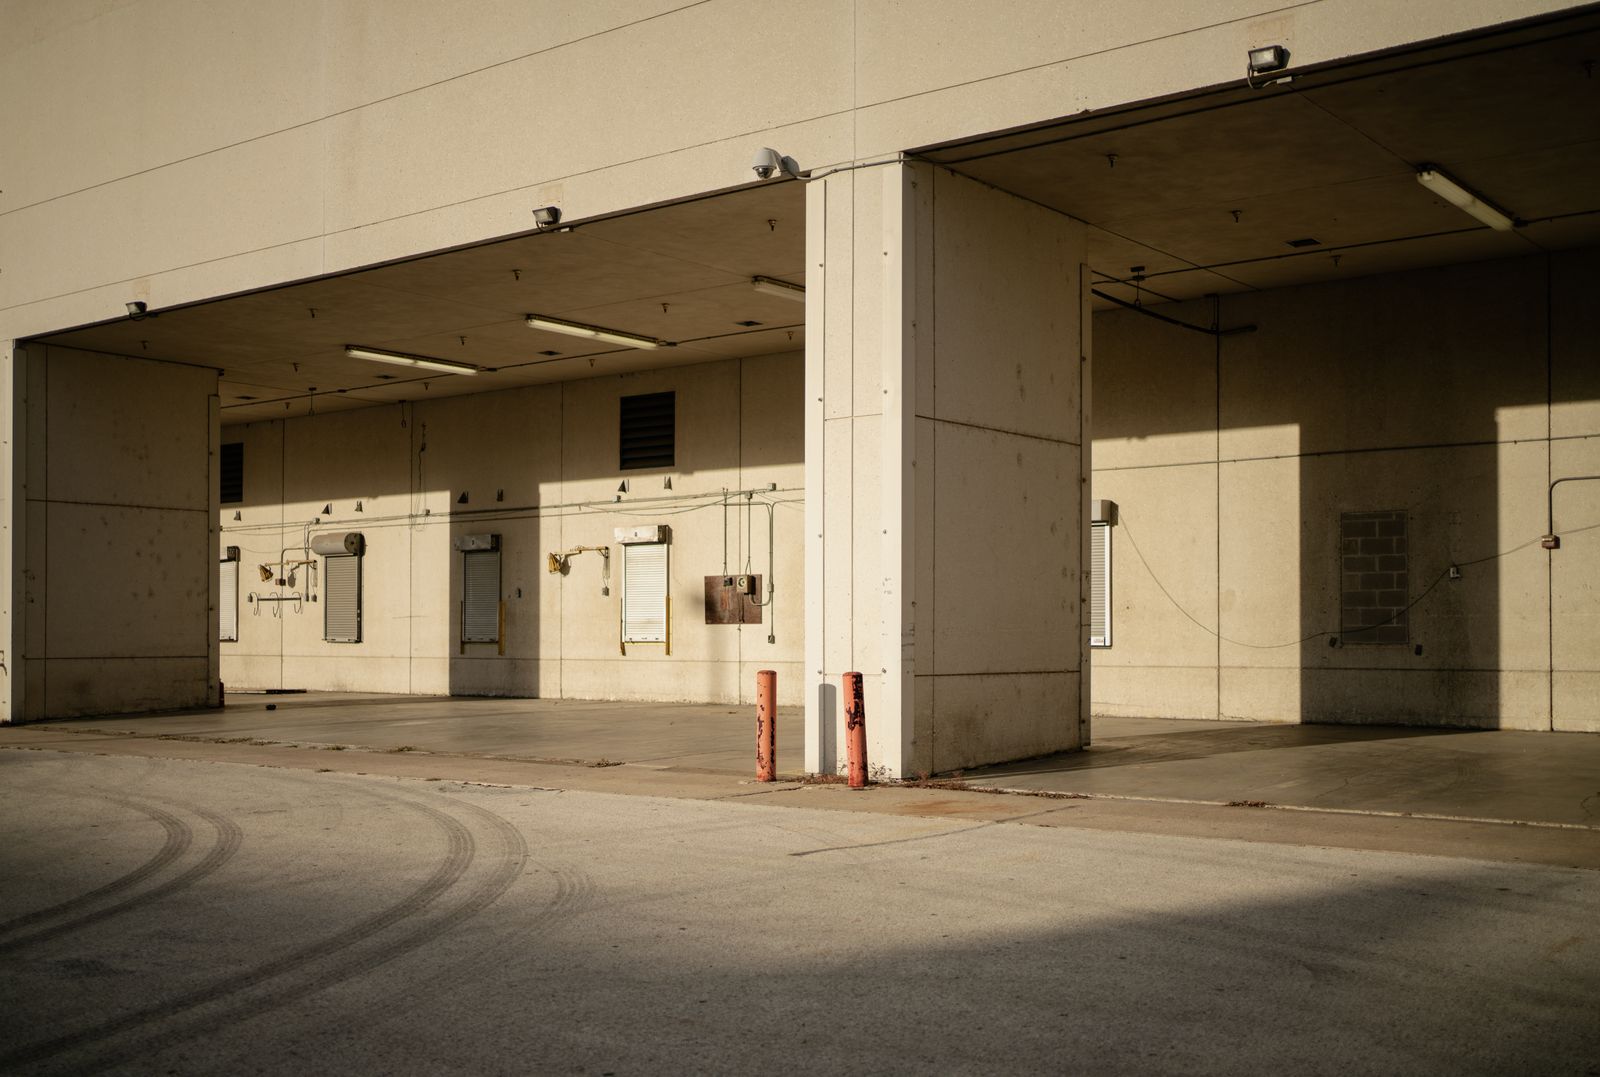
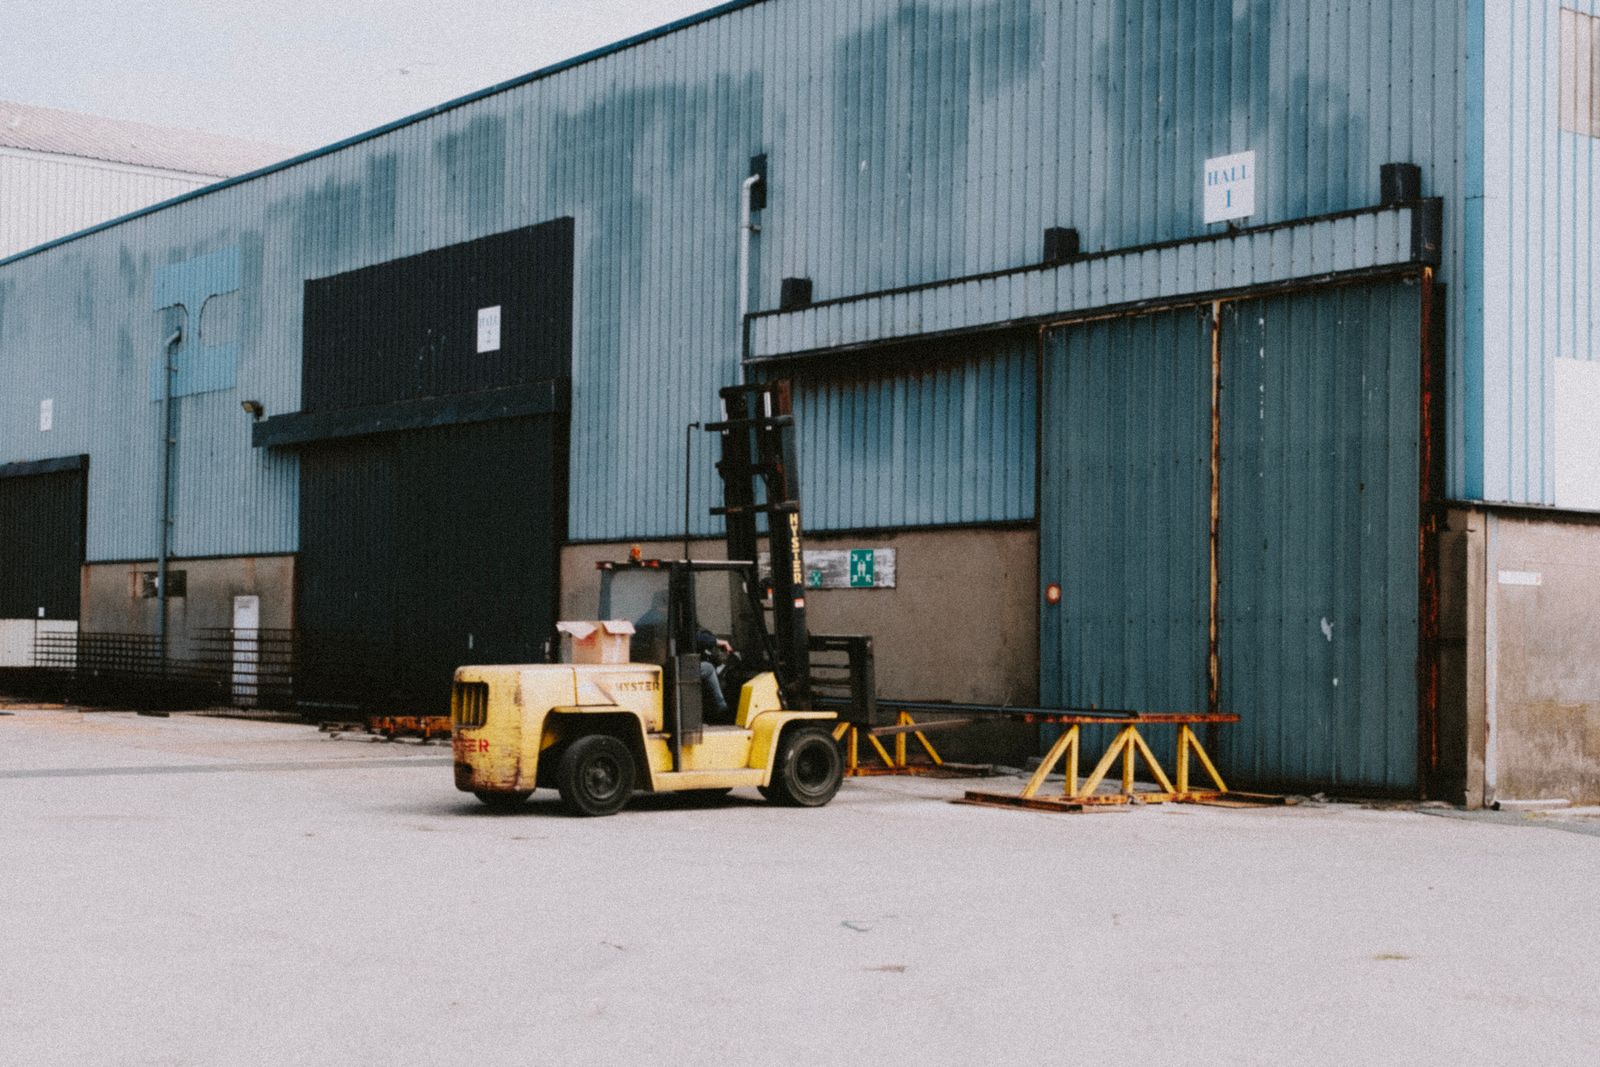
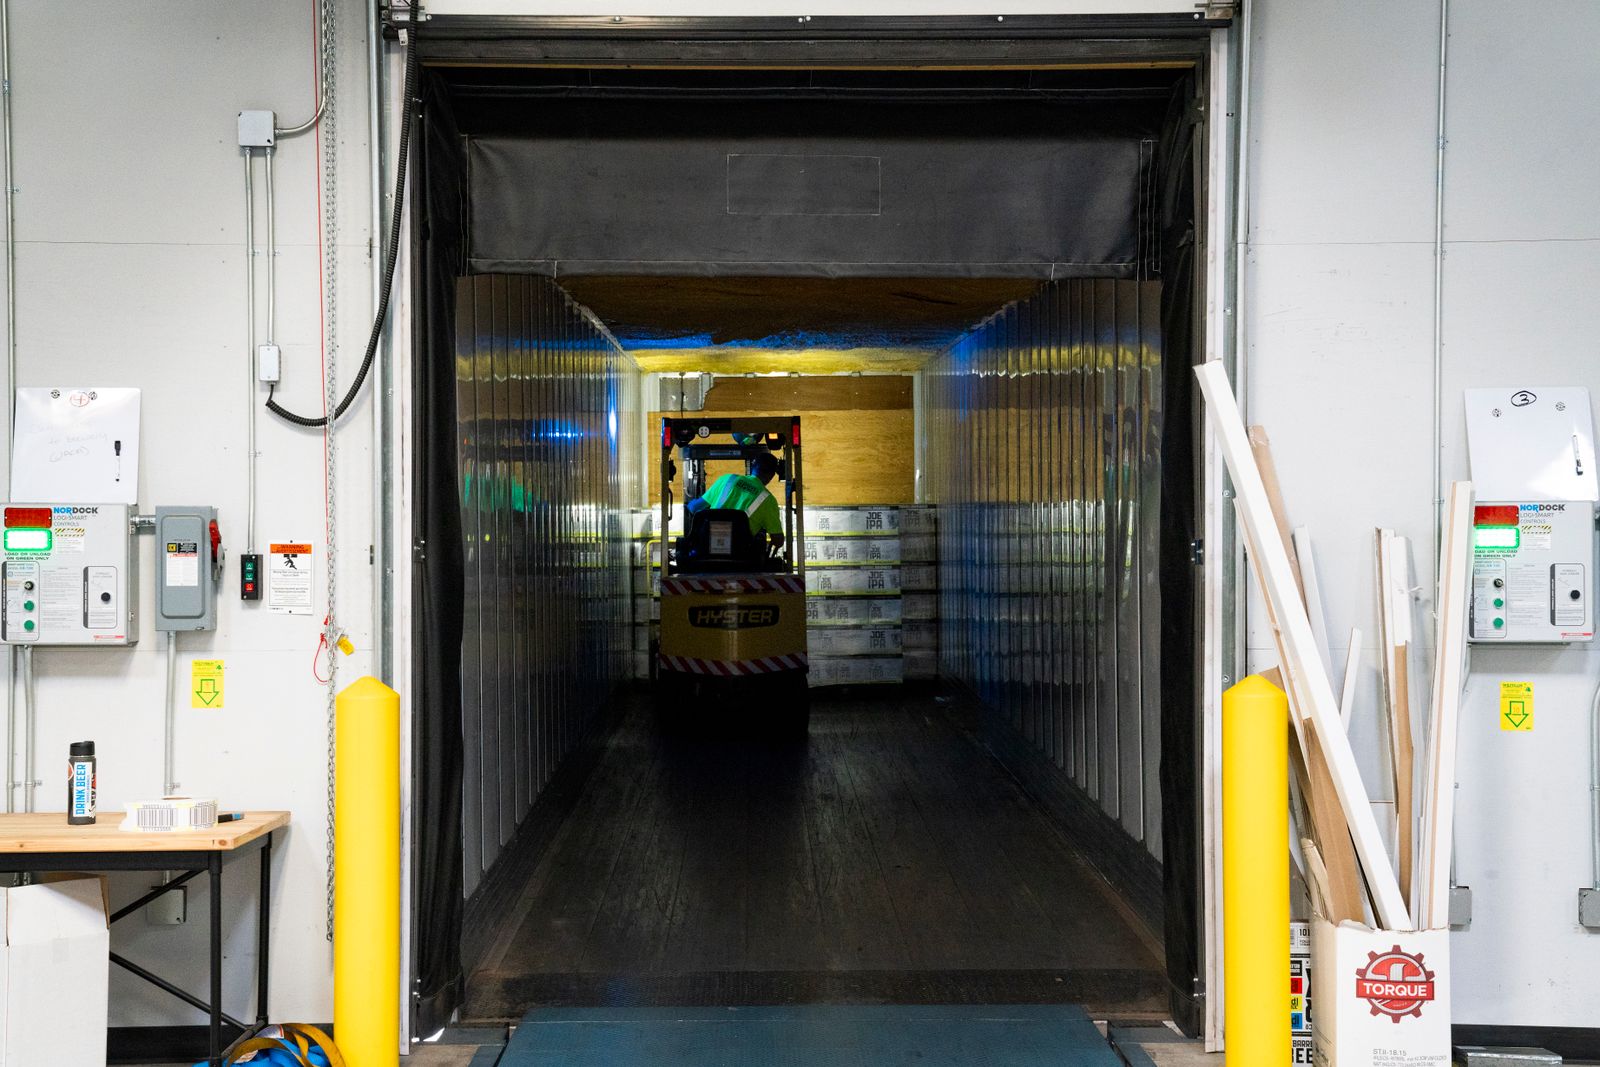
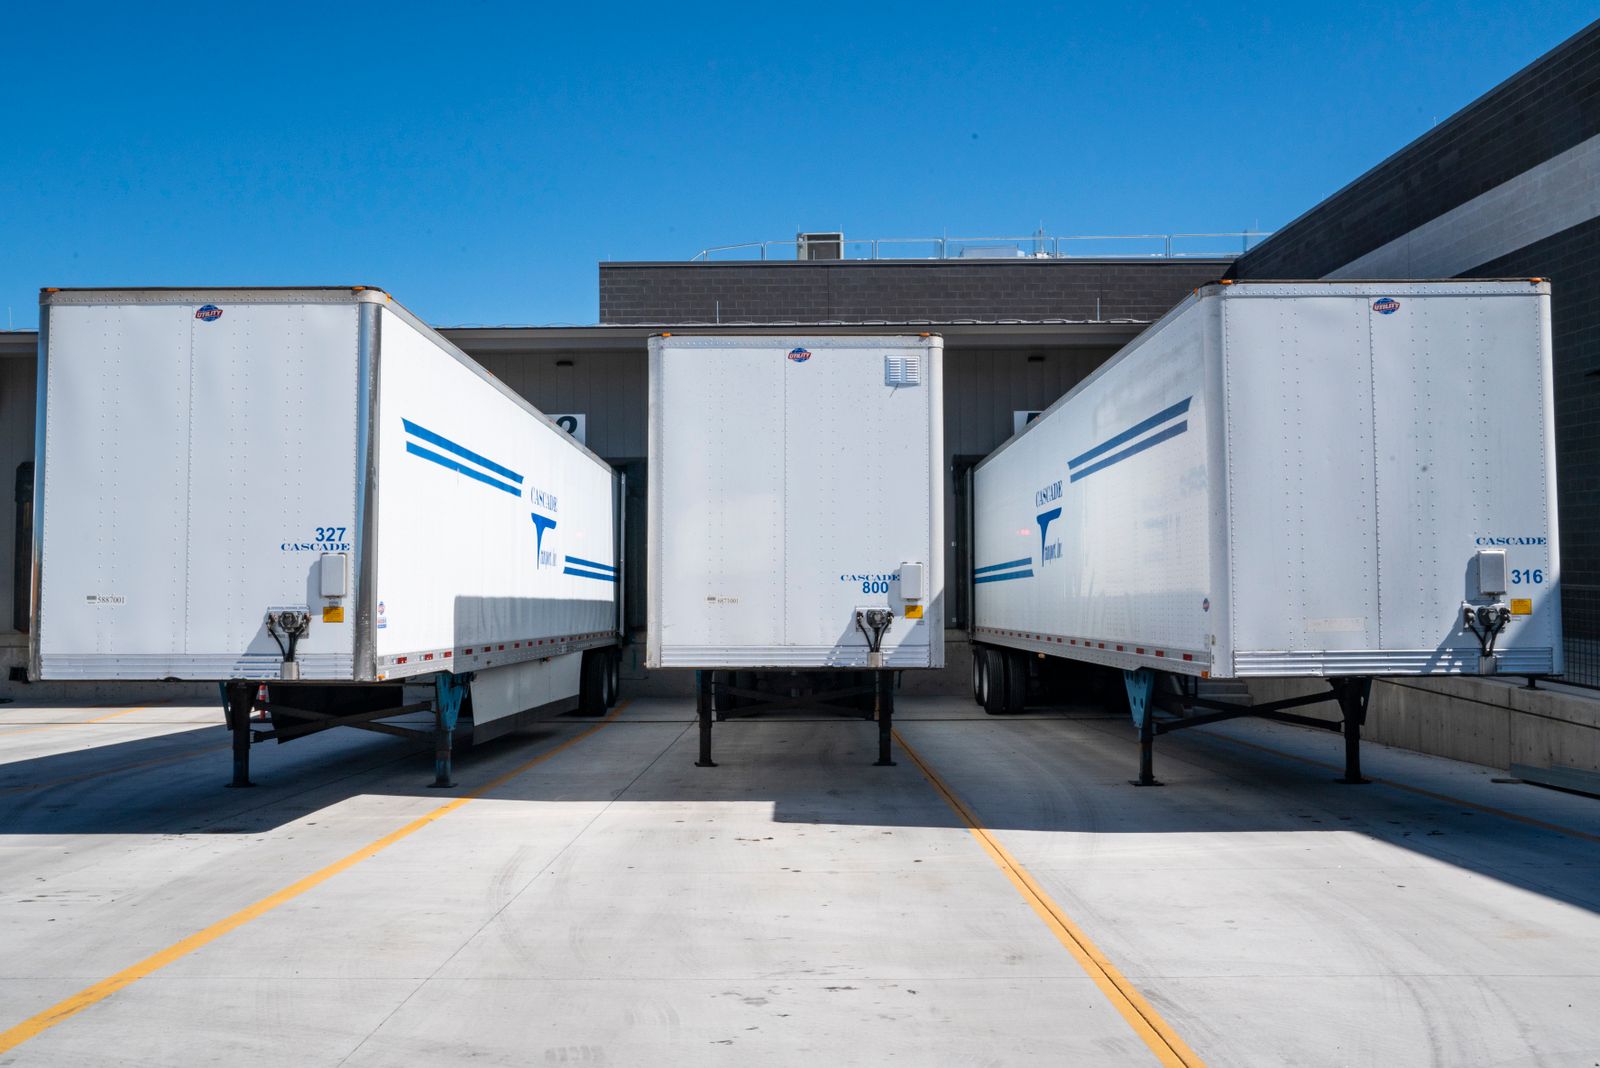

Eagan and Airport South
Endcaps, storefronts and single tenant net lease assets, priced against real Twin Cities comparables.


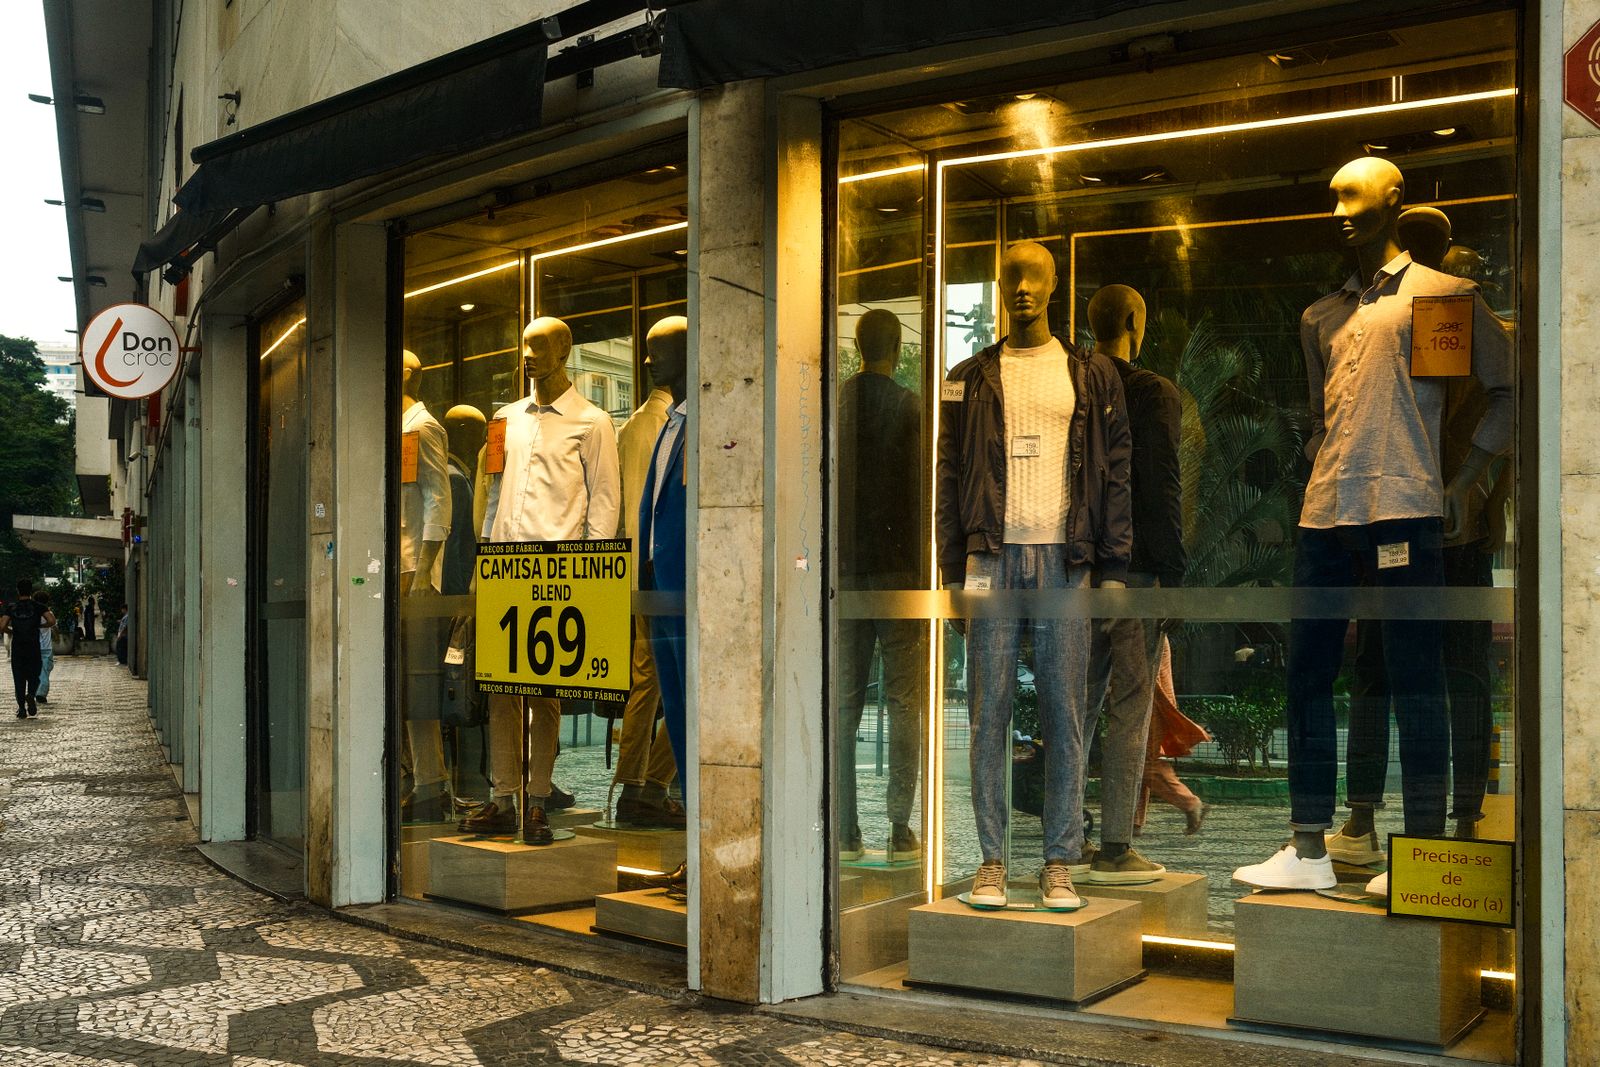
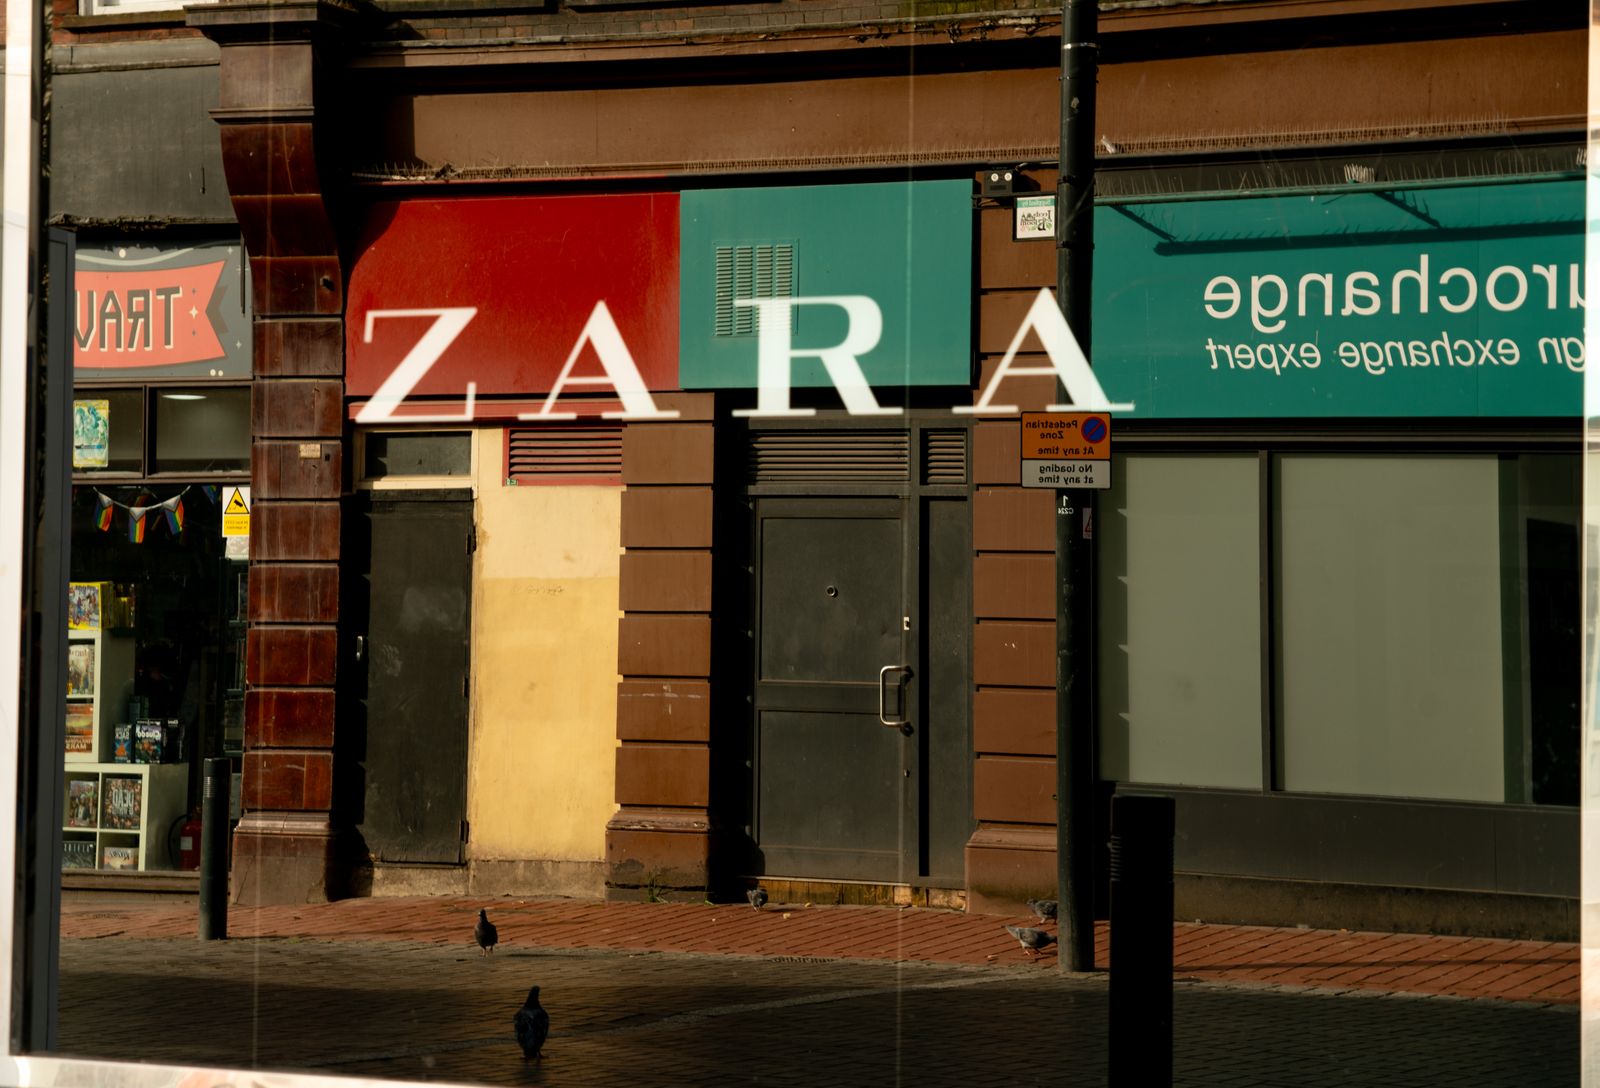

Retail availabilities
Six practices, one brokerage. Occupiers on one side, owners and investors on the other.






Tenant representation
MN Broker Licence #XXXXXXXX (placeholder) · Demonstration site with sample content
The deepest office inventory in the state and, at the moment, the widest gap between what a tower asks and what a tenant pays.
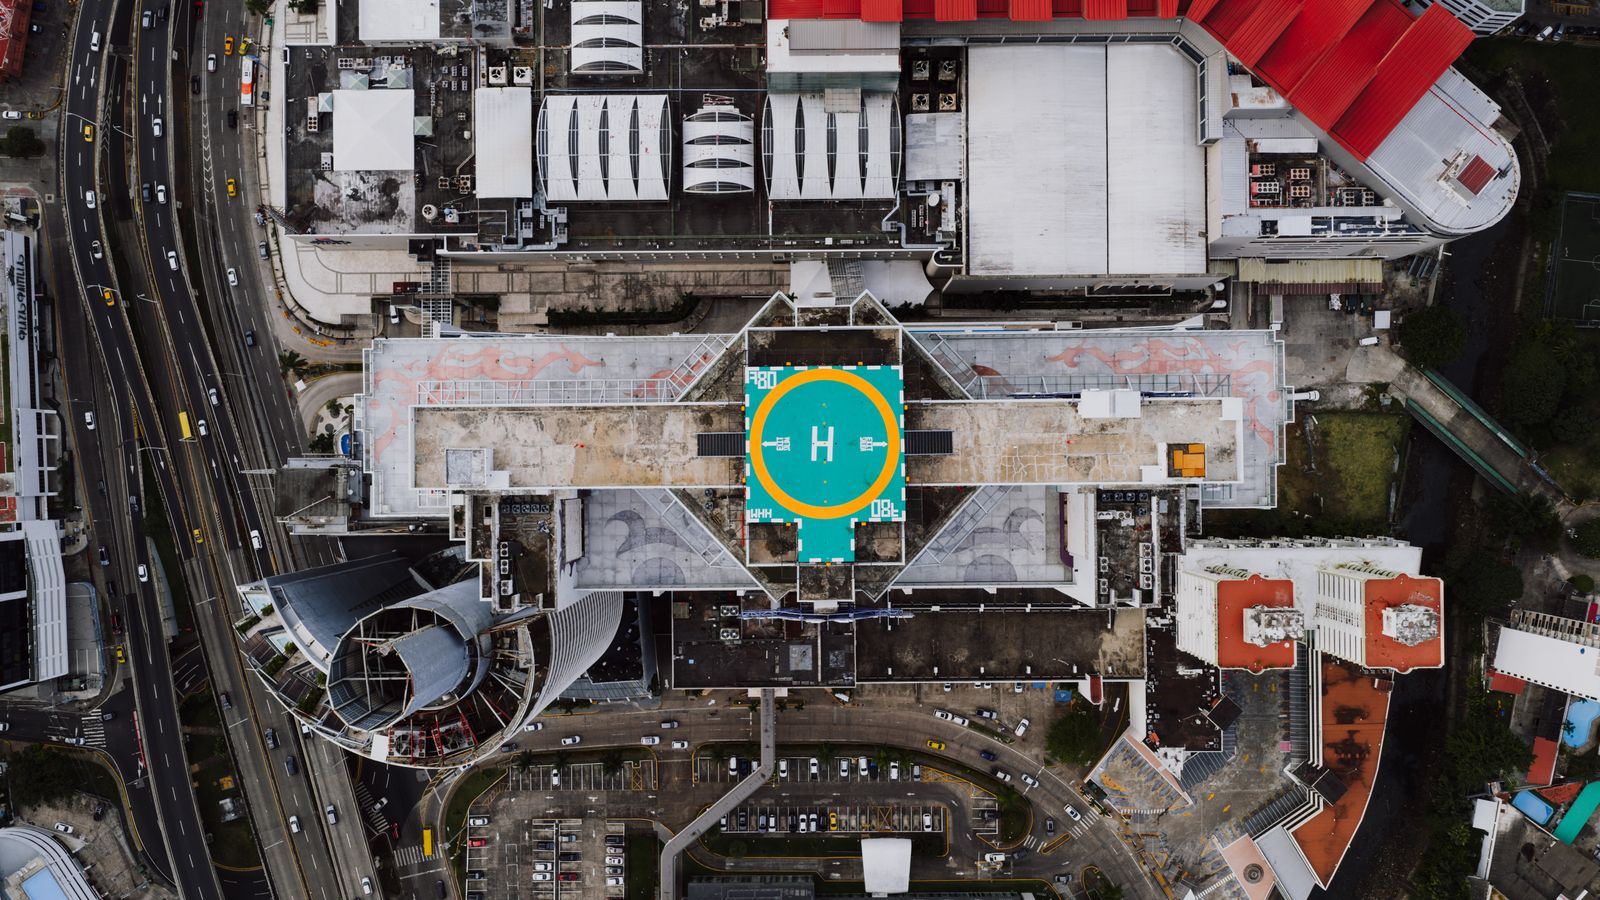
Downtown Minneapolis holds roughly 32 million square feet of office inventory across three distinct products: the skyway connected towers on Marquette, Nicollet and Second Avenue; the converted warehouse stock in the North Loop; and a thin band of newer construction around Downtown East.
The three behave nothing alike. Tower space carries load factors of 1.15 to 1.20 and asks in the high teens to low twenties on a triple net basis with operating expenses in the 13 to 15 dollar range. North Loop brick and timber asks in the mid twenties but on a modified gross basis with load factors as low as 1.09, which narrows the real gap considerably once you compare gross occupancy cost per usable square foot.
Concessions remain the story. Improvement allowances and free rent packages on longer term deals are at levels we have not seen in a decade, which means the headline rate on a flyer tells you very little about what the deal actually costs.
Seven metrics per property type. Sublease availability is listed separately because it competes with direct space on price and the headline vacancy figure hides it.
| Property type | Vacancy | Sublease available | Net absorption | Under construction | Asking rate | Structure | Year on year |
|---|---|---|---|---|---|---|---|
| Office | 23.8% | 1,840,000 SF | -312,000 SF | 0 SF | $18.90 | NNN | -1.8% |
| Retail | 9.4% | 42,000 SF | +38,000 SF | 46,000 SF | $28.50 | NNN | +1.2% |
| Industrial | 3.1% | 18,000 SF | +24,000 SF | 0 SF | $11.40 | NNN | +4.4% |
Quoted nnn.
Quoted nnn.
Quoted nnn.
Sample Illustrative figures for a demonstration website. Real submarket research is published quarterly and is available on request.
330 Marquette Avenue South, Minneapolis
A full-floor plate on 22 with skyway access, second generation improvements in place and a landlord willing to fund the difference.
Space detail412 North Third Street, Minneapolis
Timber and brick loft space with a 1.09 load factor, which is the lowest of any office availability we track downtown.
Space detail
Dana Okonkwo
Principal, Tenant representation, office
Dana founded the tenant representation practice at Northline in 2016 after seven years on the landlord side of downtown office, which is where she learned exactly how a landlord's proposal is constructed and which lines in it are actually soft.
We will send the current availability set, the comparable deals we know about and an honest view of what the submarket will actually agree to.
We value your privacy
We use cookies to run this site, remember your preferences and understand how it is used.Cookie policy