018 inputs
Occupancy cost and net effective rate
Turn a proposal into an annual cost, a cost per employee and a net effective rate over the term.
Occupiers comparing proposals
Open the calculatorTwin Cities office, industrial, retail and investment. Demonstration site with sample content.
Downtown towers, North Loop creative space and suburban campuses, leased on your side of the table.

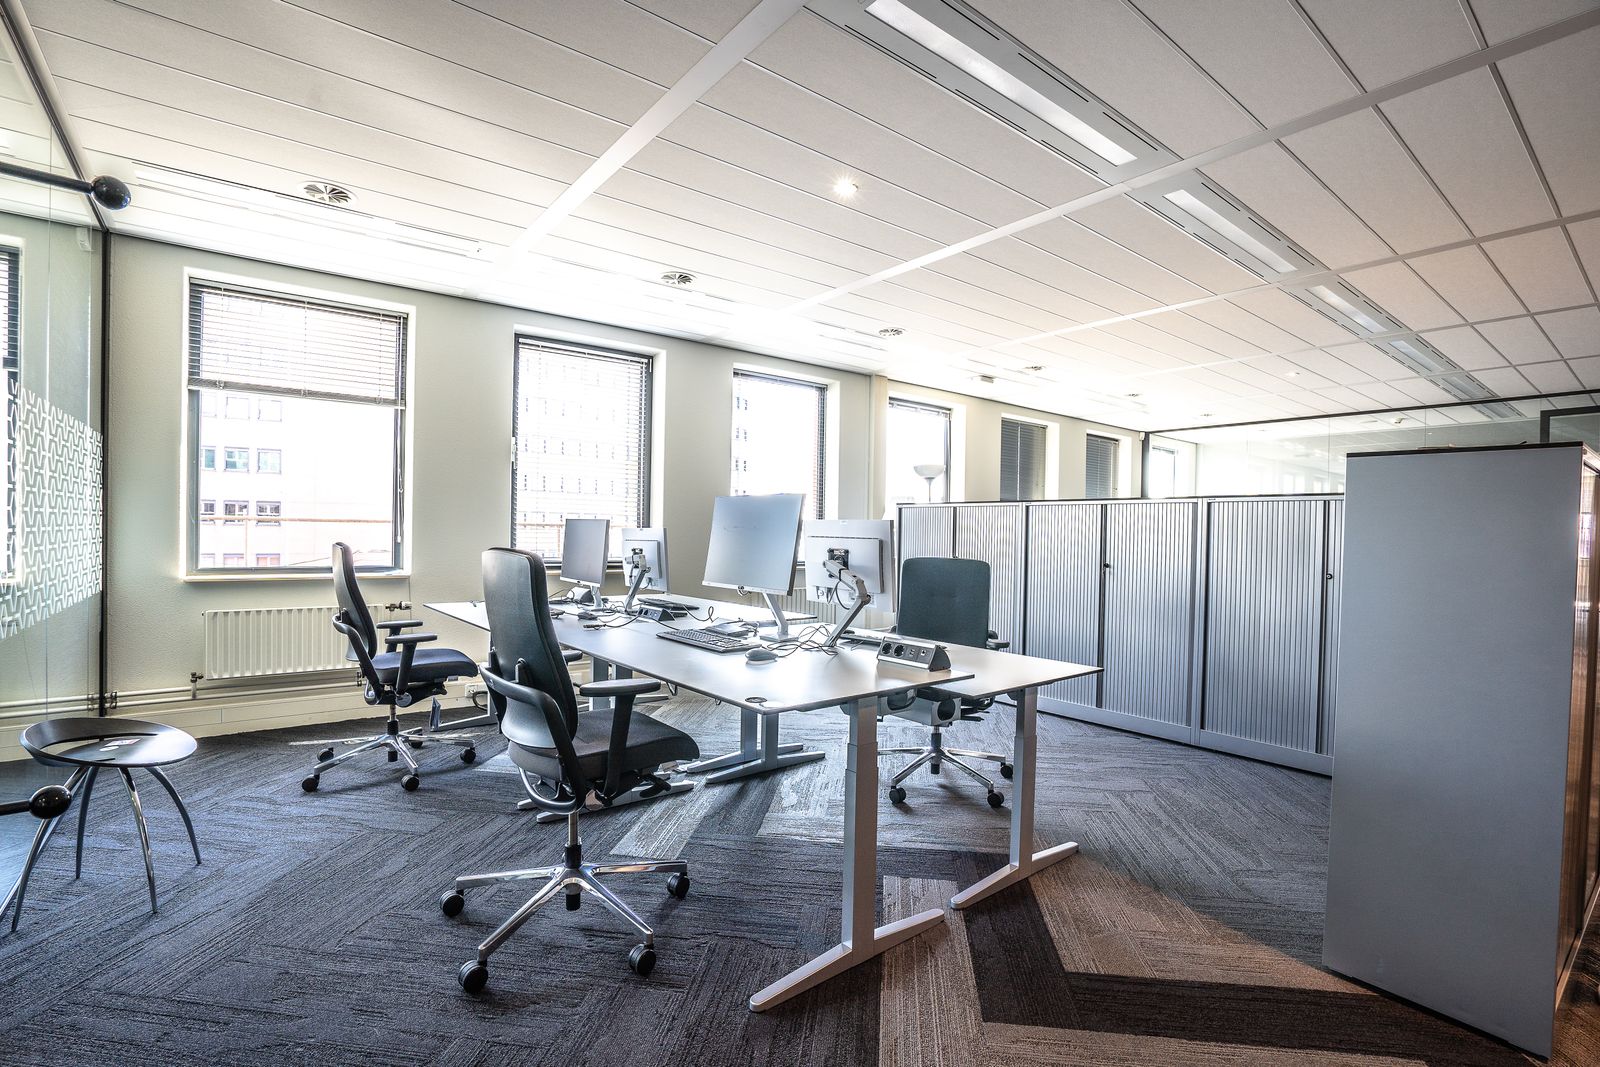



Minneapolis CBD
Distribution, light manufacturing and crossdock buildings across the airport south and northwest corridors.

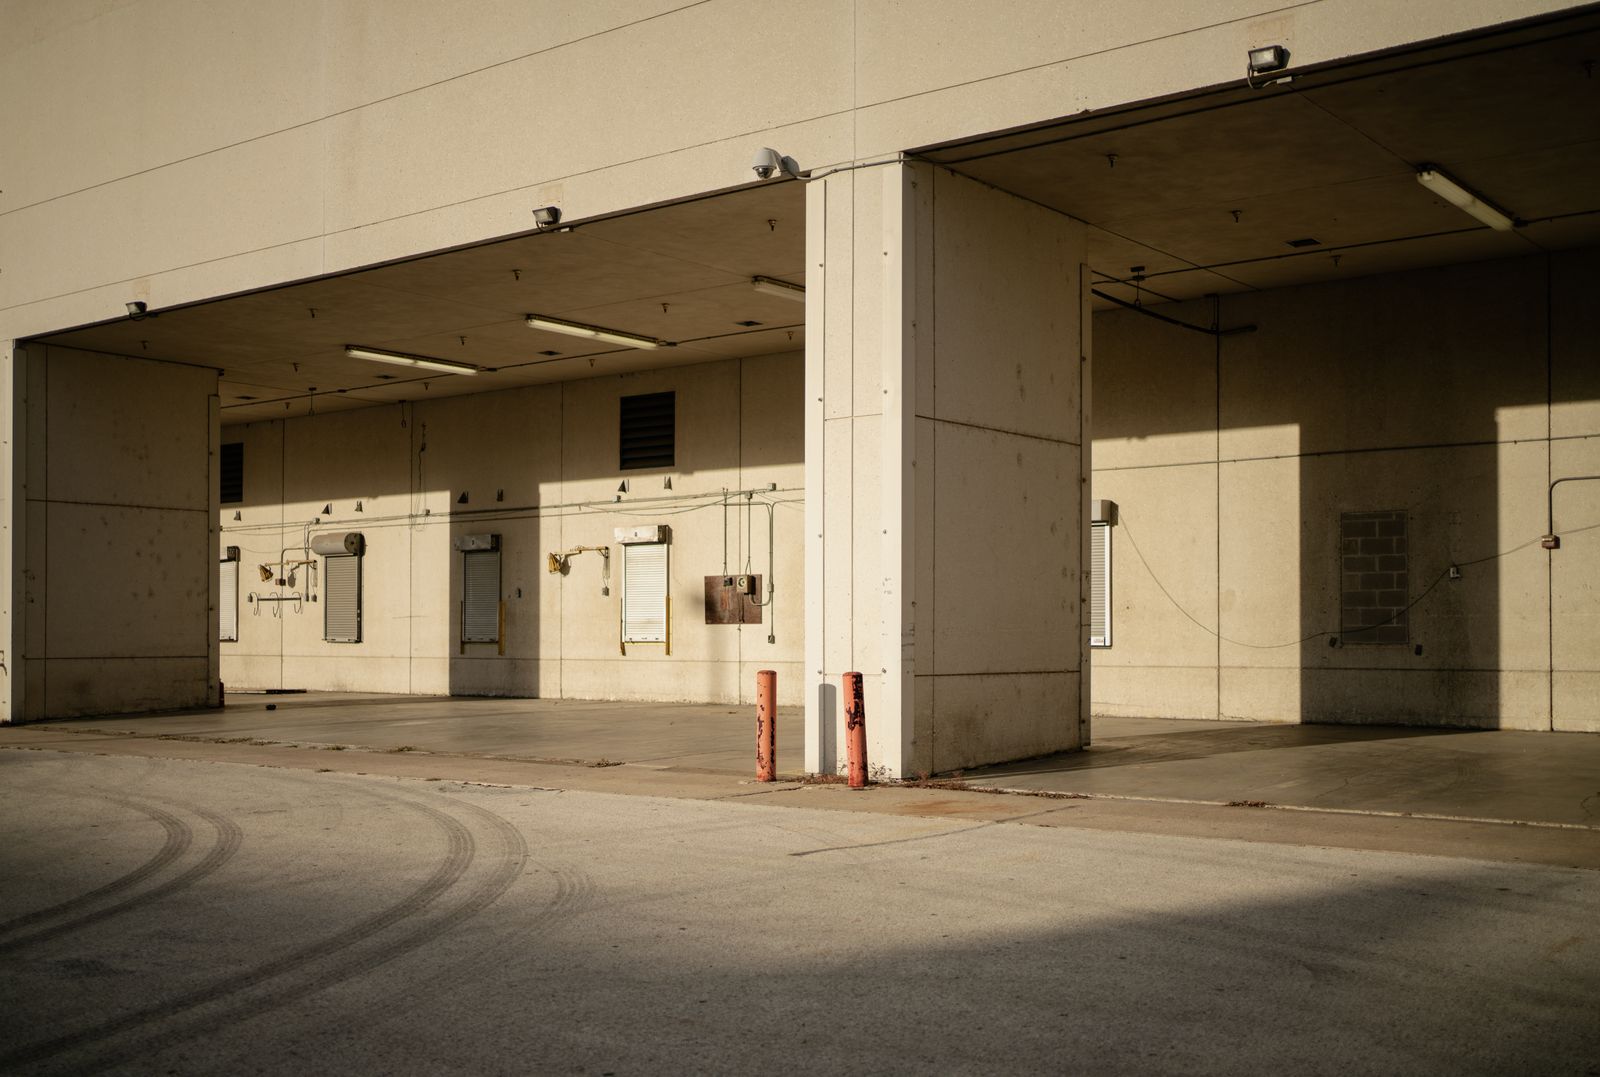

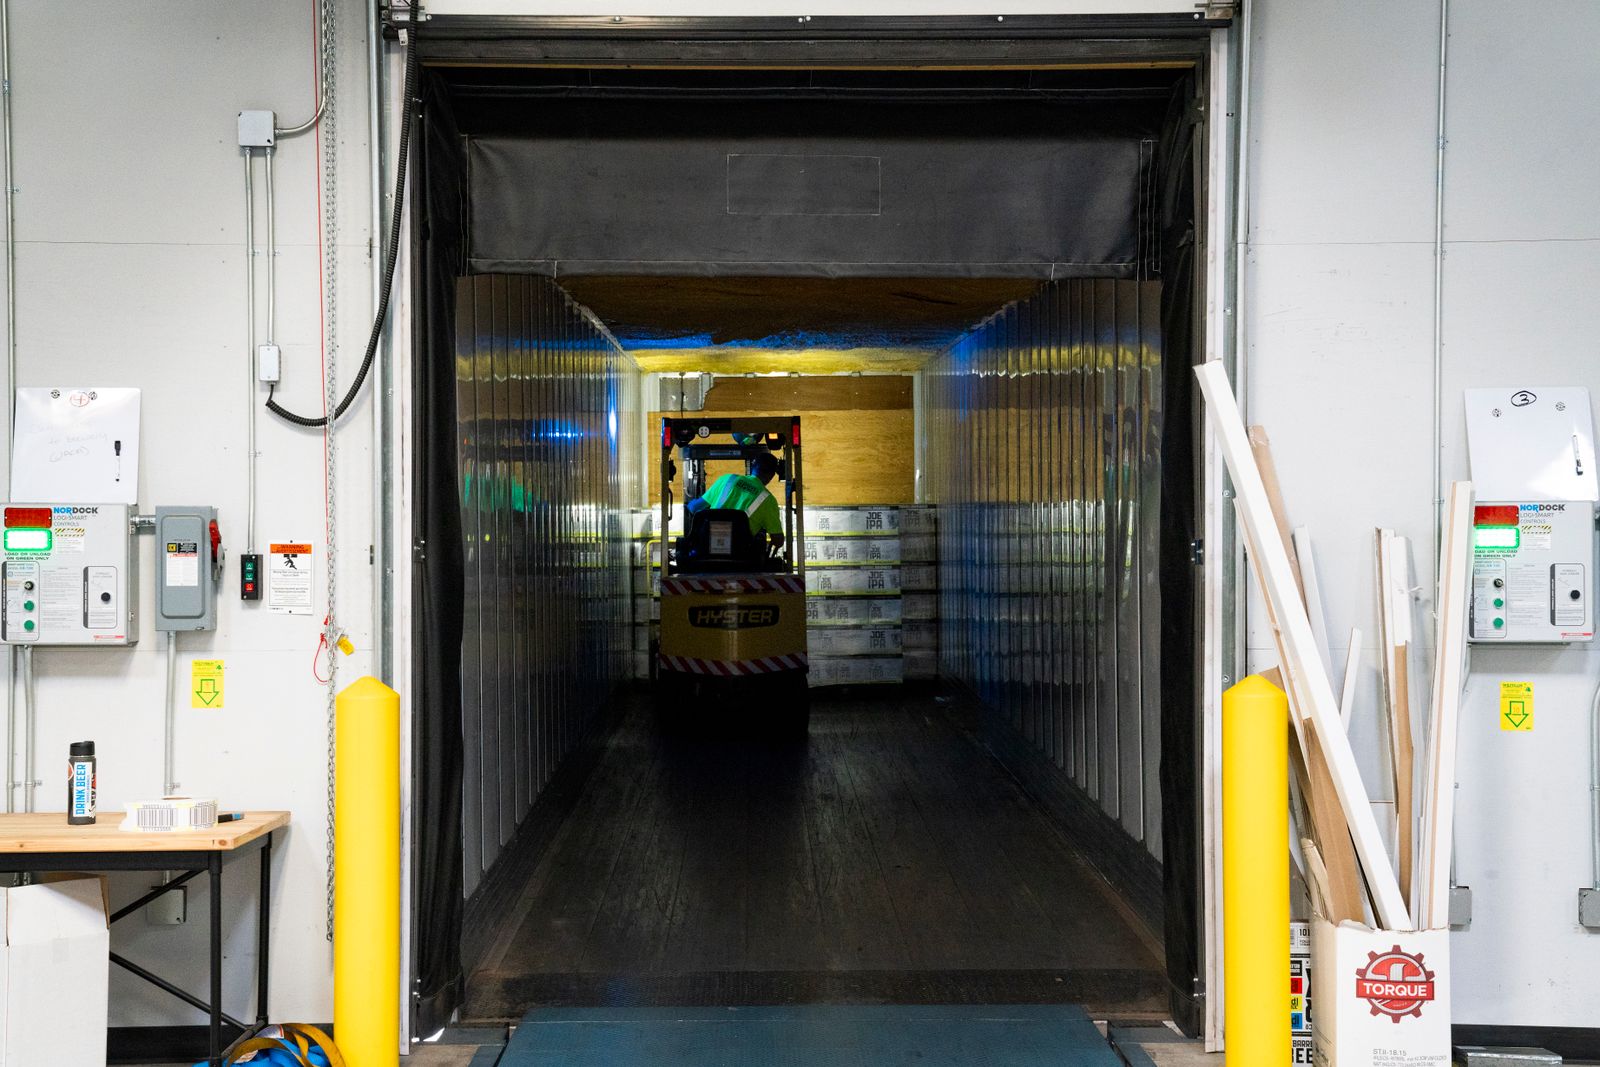
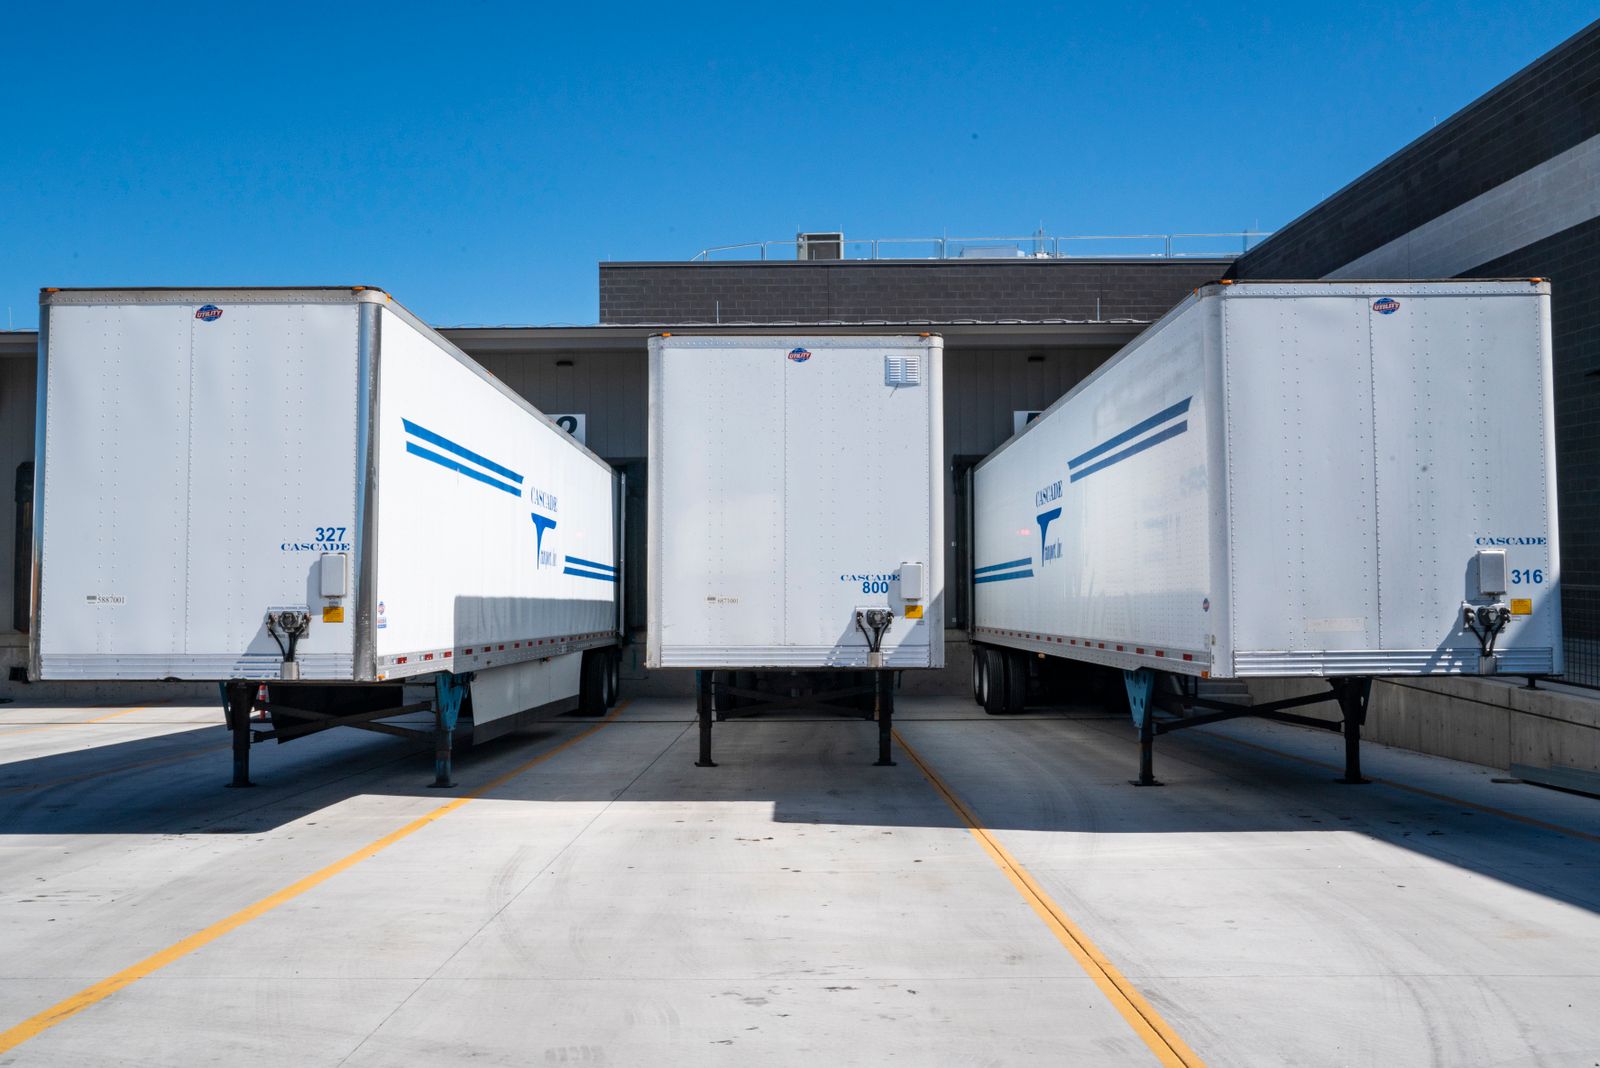

Eagan and Airport South
Endcaps, storefronts and single tenant net lease assets, priced against real Twin Cities comparables.





Retail availabilities
Six practices, one brokerage. Occupiers on one side, owners and investors on the other.






Tenant representation
MN Broker Licence #XXXXXXXX (placeholder) · Demonstration site with sample content
Every one of them models something a flyer will not: what a proposal really costs over its term, how much corridor you are renting, and how a lender will actually size a loan.

Turn a proposal into an annual cost, a cost per employee and a net effective rate over the term.
Occupiers comparing proposals
Open the calculatorHow much common area you are renting, what it costs a year, and how four building types compare.
Office and medical occupiers
Open the calculatorNet operating income, value at a cap rate, then loan sizing under both loan to value and debt service coverage.
Owners, buyers and 1031 exchange investors
Open the calculatorSample These are screening models built for a demonstration website. They are not appraisals, loan quotes or advice, and they ignore costs that a real deal carries.
Send the proposals over and we will model them side by side, on the same assumptions, with the differences written down.
We value your privacy
We use cookies to run this site, remember your preferences and understand how it is used.Cookie policy